Module 7: Business Valuation
Accountants and financial analysts must frequently estimate the fair market value of a business enterprise, its individual assets and liabilities, or damages that it has caused or incurred as a result of actions such as breach of contract or patent infringement. Fair market value is the price that willing and rational buyers and sellers with full information agree upon.
Business valuation is a complex process that is prone to errors because of difficulties accurately forecasting a company’s future operations. This is why having an experienced professional with a background in valuations is so important to an organization. In Canada, professionals can earn the Chartered Business Valuator (CBV) or Chartered Financial Analyst (CFA) designations to develop their skills in this important area. Many public accounting firms offer business valuation services in addition to their traditional services in business advisory, taxation, financial reporting and insolvency. Investment bankers apply valuation principles when advising clients on public offerings or corporate restructurings. Venture capitalists employ them to price start-up companies.
The income, market multiples, asset-based and residual income approaches are used to value a business. With the income approach, a business’ future operating cash flows are forecasted and then discounted using an appropriate cost of capital. The market multiples approach is a simpler method that uses industry average ratios such as price/ earnings, price/book value or price/sales. These ratios are multiplied by a company’s own earnings, book value, or sales per share to determine its fair market value. The asset-based approach takes a business’ historical cost balance sheet and restates its total assets and liabilities at fair value and possibly includes an estimate of goodwill. Finally, residual income starts with a firm’s book value and adds any income a business expects to earn in excess of its equity investor’s required rate of return.
These business valuation methods are also used in Module: Mergers and Acquisitions and Corporate Restructuring to determine take-over bids for business acquisitions.
7.1 | Business Valuation Basics
Definitions of Value
The value of a business can be defined in a number of different ways.
- Market value. The price that a business or its specific assets or liabilities trade at in efficient markets.
- Fair market value. The price that a business or its specific assets or liabilities should trade at in efficient markets. Fair market value is estimated by business valuators when a market value is not available or markets are not operating efficiently.
- Investment or acquisition value. By combining two companies, the acquirer is able to realize synergies such higher prices or economies of scale that justify paying more than the target firm’s fair market value.
- Intrinsic value. This is what an equity analyst believes a firm is truly worth after considering all relevant information and eliminating any short-term pricing irregularities. If financial markets are efficient, the intrinsic value should match the market value or the fair market value meaning there is no mispricing due to market inefficiencies. Passive investors believe markets are efficient and typically invest in stock index mutual funds or exchange traded funds (ETFs) with minimal stock turnover. Active investors think that abnormal returns or alphas can be earned by identifying mispriced shares. If the current share price in lower than its intrinsic value, the analyst will issue a buy recommendation believing the company is undervalued. The opposite will happen if the share price in above its intrinsic value. Continuous trading in search of alpha results in high stock turnover.
- Going-concern value. The value of a company and its specific assets and liabilities when it is assumed the business will continue to operate with the goal of maximizing shareholder value. Companies trade at a premium to the value of their net assets and liabilities because of the goodwill an organization is able to generate through its strong reputation, experienced workforce, and established systems and procedures. Market, investment, and intrinsic value all assume a business will continue to operate as a going concern.
- Liquidation or breakup value. The value of a business or its specific assets or liabilities when it is assumed that the company will discontinue its operations. The liquidation value is generally below the going-concern value, but in some cases when a company is poorly managed, under competitive pressure, or experiencing financial distress, this may not be true. These firms are said to be worth more “dead than alive.”
Applications of Business Valuation
There are many situations where a company needs to value a business or its specific assets or liabilities. The most important include:
- Private company transactions. The majority of corporations are privately held by a small group of investors including the founder(s), their family members, managers, and employees. These investors may want to buy additional shares or to sell them upon their death, disability, termination of employment or if they decide to retire, change jobs, or diversify their investment portfolios. These shares do not trade publicly, so business valuators provide a fair market value estimate. Valuators also help improve the company’s operations prior to sale so shareholders receive the best possible price. This includes finding interested buyers, overseeing the bidding processes, and completing all formal purchase or shareholder/partner rights agreements.
- Initial or secondary public offerings. Private companies go public to increase their access to capital and provide investors with greater market liquidity when selling their shares. Secondary offerings are used by public companies to raise additional equity capital to fund growth opportunities when retained earnings are insufficient. Business valuators help determine an appropriate offering price in both situations.
- Buy, sell or hold recommendations. Major public companies are followed on an on-going basis by a group of equity analysts who regularly issue earnings forecasts and formal research reports. In these reports, analysts make buy, sell or hold recommendations to their clients based on a thorough review of the company, its industry, and the overall economy and an estimate of the share’s intrinsic value.
- Timing stock repurchases. Stock repurchases provide management with greater financial flexibility as they are not committed to paying regular cash dividends. Repurchases are best made when a company’s shares are undervalued so to benefit the remaining shareholders. A business valuation helps determine when these shares are mispriced.
- Internal management. A manager’s primary goal is to maximize shareholder value, so they want to know if their firm’s share is undervalued. If it is, they will act to correct the market’s misperception. Management also wants to know the effect new strategic initiates will have on the share price, so they can better sell these ideas to the firm’s board of directors, shareholders, and stock analysts.
- Take-over bids. Companies sometimes buy other businesses to generate synergies for themselves or the target firm leading to a higher share price post acquisition. Business valuators carefully measure these synergies so the acquirer does not over pay.
- Fairness opinions. If shareholders receive a take-over bid from a potential acquirer, management must provide them with a fairness opinion before the offer expires. This opinion includes a valuation of the company and a recommendation whether to accept or reject the offer.
- Ownership percentages for venture capitalist. Venture capitalists provide needed financing to risky start-up companies when other investors will not. The value of a start-up must be measured, so the venture capitalist receives an appropriate portion of the firm’s equity in exchange for their investment. This is particularly difficult for new companies as their growth prospects are uncertain and their shares do not yet trade publicly.
- Valuing divestiture, spin-off or going private transactions. A company may sell or spin-off part of its operations for a variety of reasons such as to focus on its core business or to raise needed capital. A majority owner or group of managers may also decide to take a public company private to avoid the scrutiny of the financial markets so they can focus on a business turnaround. A business valuator needs to determine an appropriate asking price.
- Liquidations or reorganizations. When a company experiences financial distress and is declared bankrupt by the courts, it can either sell its assets and pay what it raises to its creditors (i.e. liquidation) or attempt to restructure its operations with the goal of successfully re-emerging from bankruptcy (i.e. reorganization). Being able to accurately value a business’ assets is critical to getting the most possible for creditors in a liquidation. In a reorganization, valuation principles are used to determine the percentage ownership creditors will receive in a debt-for-equity swap or in exchange for new equity financing.
- Share-based compensation. A large portion of management compensation comes from stock options and restricted shares in order to directly tie pay to share performance thus reducing agency costs. Business valuation tools are used to design these plans so they provide adequate compensation.
- Fair value accounting in financial reporting. International Financial Reporting Standards (IFRS) allow companies to report many of their tangible and intangible assets and liabilities at fair market value instead of historical cost to improve the quality of financial reporting. Intangible assets like brand names or trademarks are particularly difficult to appraise. Valuation principles are also used to allocate the purchase price in a business acquisition between a company’s fixed assets, intangible assets, and goodwill and to measure any subsequent goodwill impairments.
- Transfer pricing. Transfer pricing provides an accurate measure of a division’s or geographic area’s performance by fairly valuing intercompany sales. Companies may manipulate transfer prices to lower taxable income in a high-tax jurisdiction or increase profits in a certain business unit. Business valuators can help companies establish fair transfer pricing systems, mediate any company disputes, and provide expert testimony when the fairness of transfer prices is challenged in the courts.
- Fair value of assets for tax purposes. Under the Income Tax Act (ITA), an asset’s fair market value is used to calculate any capital gains taxes owed in a deemed disposition of property or a non-arm’s length transaction. A deemed disposition occurs when a person is considered to have disposed of property even though a sale did not occur. This is common with the transfer of property as a gift or when a business is given or sold to a family member upon the death of a taxpayer. Non-arm’s length transactions are with related persons where the fairness of the consideration is usually questioned.
- Litigation support. The fair market value of damages must be quantified for cases such as breach of contract, insurance claims, intellectual property infringement, business interruption, product or professional liability, asset expropriations, construction contract matters, personal injury, matrimonial property issues, or disputes with minority shareholders. If the parties cannot reach an agreement, the matter is referred to the courts and a business valuation professional may be asked to provide expert testimony concerning appropriate damages.
Sell-Side and Buy-Side Analysts
Financial markets are divided into sell-side and buy-side activities. The sell-side primarily consists of investment bankers who construct, promote and sell financial instruments such as stocks, bonds, and derivatives. These securities are sold to the buy-side of the market consisting of both retail and institutional investors including pension plans, insurance companies, banks, trust companies, hedge funds, mutual funds, ETF companies, and other investment management firms.
Investment banks employ sell-side analysts to assist in pricing initial and secondary public offerings and provide ongoing coverage of these shares in the secondary market. The earnings forecasts, research reports, and buy, sell, or hold recommendations these sell-side analysts provide are valuable sources of information. The website of a large corporation typically lists the sell-side analysts that follow their firm.
Buy-side analysts work for institutional investors making recommendations that are used in managing their funds. These analysts collect information from company financial disclosures, sell-side analysts, conference calls with management, company visits, and financial information firms such as Bloomberg or Thomson Financial. Any information is typically used by the institutional investor only and is not shared with the public.
Whether the investment recommendations made by sell-side analysts are objective is a contentious issue in the investment industry. Investment bankers directly benefit from any favorable coverage provided by their sell-side analysts through a higher initial public offering price or a corporate client’s promise of future investment banking work. Many investment bankers also provide investment advisory services to individual and institutional investors. Financial firms do attempt to separate the activities of these units through strict ethical standards relating to the exchange of information. Despite this, investment advisory clients worry that financial advisors will be forced to purchase shares on their behalf to support a corporate client’s share price contrary to their best interests. The movement of insider information between the investment banking and investment advisory units about possible corporate acquisitions, changes in dividend policy, or other corporate finance issues that will affect the share price is also a concern.
7.2 | Income Approach – Dividend Discount Model
The value of any asset is equal to the present value of the future cash flows investors will receive. For a rental property, the cash flows are the rental payments minus any cash expenses. For a bond, they are the regular interest payments plus the return of principal at the end of the bond’s life. Determining the value of a business and its equity securities is no different. A share’s value is equal to the present value of all future dividends that are paid to the common shareholders. Preferred share dividends are not included as they are considered debt payments for valuation purposes. These shareholders are not entitled to any of the business’ residual income like common shareholders but only fixed payments like bond holders.
It is impossible to tell exactly how long most companies will survive, so valuators adopt the going concern principle and assume that their dividends will grow indefinitely. Lower dividends now will mean higher dividends in the future as earnings are re-invested in the business. Obviously, it is very difficult to accurately estimate the value of anything over an indefinite period. To deal with this uncertainty, business valuators use three variations of the dividend discount model (DDM).
Variations of the DDM
- One-stage or constant growth. This model assumes that dividends grow indefinitely at the same rate. Using the present value of a perpetuity with growth formula, the intrinsic value (V0) of a business today can be determine based on estimates of next year’s dividend (D1), the appropriate cost of common equity (kc), and the expected long-term growth rate of the company’s dividends (gd).
- [latex]V_{0}=\frac{{D_{1}}}{{k_{c}-g_{d}}}[/latex]
- This model is best used to value mature companies with stable long-term earnings and dividend growth rates and a consistent relationship of dividends to earnings (i.e. a stable dividend payout ratio) over time.
- The growth rate cannot exceed the nominal growth rate of the economy which is normally 2.0% to 3.0% or the company will essentially become the economy over the long term, but it can be less for slow-growth, no-growth or negative-growth companies. The cost of common equity reflects the risk level of the asset being valued. Calculating the appropriate cost of common equity, cost of debt and the weighted average cost of capital were examined in Module: Cost of Capital. For simplicity, the capital asset pricing model (CAPM) will be used throughout this unit to estimate the cost of common equity. CAPM states:
-
[latex]k_{c}=k_{f}+B_{a}(k_{m}-k_{f})[/latex] [latex]k_{c}=\text{Cost of common equity}[/latex] [latex]k_{f}=\text{Risk-free rate}[/latex] [latex]B_{a}=\text{Beta of an asset}[/latex] [latex]k_{m}=\text{Market rate}[/latex] [latex]k_{m}-k_{f}=\text{Market risk premium}[/latex] - Two-stage. This model is more flexible as it allows for a high-growth stage of varying lengths initially possibly due to a new product innovation followed by a mature-growth stage with lower growth once industry competition intensifies, new companies enter the market, and demand stabilizes. The value of the firm relating to the mature-growth stage only is called the investment’s terminal value.
- [latex]V_{0}\frac{{(D_{0})(1+g_{\text{d high}})^{1}}}{{(1+k_{c})^{1}}}+\frac{{(D_{0})(1+g_{\text{d high}})^{2}}}{{(1+k_{c})^{2}}}+\frac{{(D_{0})(1+g_{\text{d high}})^{3}}}{{(1+k_{c})^{3}}}+\frac{{\frac{{(D_{0})(1+g_{\text{d high}})^{3}(1+g_{\text{d low}})^{1}}}{{(k_{e}-g_{\text{d low}})}}}}{{(1+k_{c})^{3}}}[/latex]
- In practice, a valuator typically includes a supernormal growth rate estimate based on their own research for the first stage which is usually three to five years. Estimating growth accurately after that is difficult, so valuators typically assume a second-stage growth rate that approximates the long-term growth rate of the economy or less as in the one-stage DDM.
- Three-stage. This model improves on the two-stage model by allowing a more gradual transition from the high-growth to the mature-growth stage by introducing a middle stage where the growth rate declines in a linear pattern. It is unreasonable to expect the change in the growth rate to occur in just one year. The length of this transition stage is subjectively determined and varies with each analyst. If the high-growth rate immediately starts to decline over a period of time until it reaches the mature-growth rate this is referred to as the H-Model.
Estimating the Dividend Growth Rate
Dividend growth rate can be estimated using a company’s historical growth rate, forward-looking growth rate, or sustainable growth rate (SGR).
- Historical growth rate. This growth rate is calculated based on either dividends or earnings or sales as a proxy for dividends. Dividends are typically more stable than earnings or sales, but the trend of substituting stock repurchases for dividends makes this amount less reliable. Stock repurchases can be incorporated into the DDM by using total distributions which are cash dividends plus stock repurchases, but repurchases are typically unstable making them difficult to forecast.
- Geometric mean provides a more accurate measure of growth compared to arithmetic mean especially when the historical growth rates have been erratic. Geometric mean is less accurate when only the first and last values are used or if either of these two values are negative, so regression smoothing should be employed. Always estimate growth over a full business cycle to average out yearly fluctuations. Adjust earnings for aggressive revenue recognition, excessive cost capitalization, deferral of discretionary costs, timing of gains and losses, or non-recurring items if the information is available. Earnings should be expressed on a diluted per share basis otherwise earnings can be raised simply by issuing more equity and earning a return.
- Research indicates that historical growth rates are not highly correlated with future growth rates. More variable historical growth rates are poorer indicators of future growth. Historical growth rates are also not good predictors of future growth rates if a company is experiencing changing competitive forces, government regulations, business mix, operations, capital structure, or dividend policy.
- Forward-looking growth rate. This growth rate is generally more accurate than a historical growth rate as it is based on forward-looking information that is not reflected in past earnings. Valuators can use their own estimates, the estimates of a particular equity analyst who follows the company, or a consensus forecast of these analysts. Financial information service firms provide consensus growth forecasts. When using the future growth rate estimates of other analysts, ensure they are not sell-side analysts that work for financial firms who have a business relationship with the company being valued. Buy-side analysts are usually much more objective.
- Research shows that forward-looking growth rates are more accurate than historical growth rates in the short term, but provide little superiority past three to five years. Using a high number of quality analysts provides better forecasts, so select analysts with the most accurate past predictions. More disagreement among analysts means consensus forecasts are less reliable.
- Sustainable growth rate. This is the growth rate of sales that a company can support using retained earnings only while maintaining constant financial fundamentals including its rate of return on equity (ROE) and retention ratio (R). ROE is a function of a firm’s rate of return on assets (ROA) and debt ratio (DR) while ROA is determined by its net profit margin (NPM) and total asset turnover (TAT). Growth rate in sales is a proxy for earnings and dividends growth.
- [latex]\text{Formula 1 }SGR=\frac{{((ROE)(R))}}{{(1-(ROE)(R))}}[/latex]
- [latex]\text{Forumla 2 }ROE=\frac{{(\text{Net income / Sales})\times(\text{Sales / Total assets})}}{{(1-(\text{Total debt})/(\text{Total assets}))}}[/latex]
- Most companies try to grow using retained earnings only because:
- Issuing new equity may create control problems for existing shareholders.
- Issuance costs for new equity are high especially for start-ups and small businesses.
- Start-ups and small businesses may have exhausted all sources of new equity.
- Earnings per share is diluted in the short-term as it takes time for new equity to be effectively utilized.
- Managers are concerned about raising new equity when their shares are undervalued as it hurts existing shareholders.
- SGR is also useful for valuing firms that have recently undergone significant operational and financial changes as their historical data is not representative of the future.
The historical growth rate, forward-looking growth rate, or SGR can be used alone or combined by calculating a weighted average of the three methods. Exhibit 1 outlines the different factors that should be considered when choosing the best method or deciding on the appropriate weights.
Exhibit 1: Selecting a Growth Rate
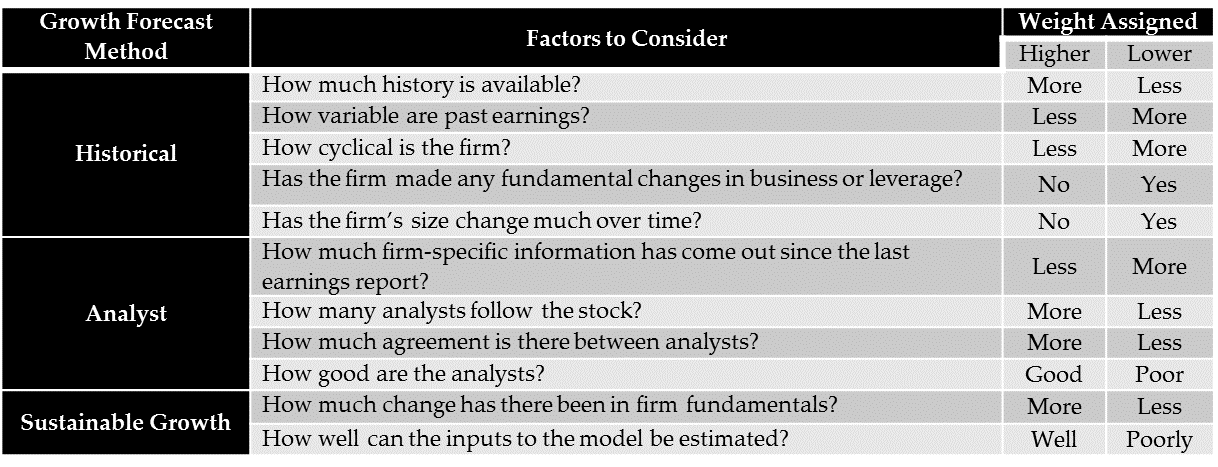
Source: Damodaran, Investment Valuation, 1996.
Applying DDM
Other factors to consider when applying the DDM include:
- The higher the growth rate during the growth stage, the shorter the growth period will likely be as growth regresses to the mean faster.
- Multi-stage models allow for non-payment of dividends initially but in practice this is difficult to implement because a lack of dividend history makes estimating future dividends problematic.
- Payout ratios, betas, growth rates, ROAs, and debt ratios vary by DDM stage. Spreadsheet modelling is used to deal with this complexity and ensure all estimates are consistently applied. As companies go from the growth to the mature stage, ROA falls as growth opportunities disappear and competition eliminates abnormally high profit margins. Payout ratios rise as less funds are needed for expansion. Debt ratios rise as mature companies become more stable and appealing to lenders. Beta falls as investments become less risky.
- Business valuators typically put little effort into determining the terminal value of a company other than to estimate the long-term growth rate, yet it accounts for a very high proportion of the firm’s value.
- Small variations in inputs such as kc and gd result in significant differences in valuations, so great care must be taken estimating these variables. Sensitivity or scenario analysis are used to test the effect of any potential errors.
- DDM only determines the fair market value of a non-controlling stake in a business when investors have no ability to influence the dividends paid. If an investor acquires a controlling interest, then another valuation approach should be adopted.
Implied kc or gd
Sometimes business valuators are not interested in the exact value of an asset, but only want to know if it is currently under or overvalued. This can be determined by using the one-stage, two-stage or three-stage models and manipulating the formula to isolate for either kc or gd.
[latex]k_{c}=\frac{{(D_{0})(1+g_{d})}}{{V_{0}}}+g_{d}[/latex]
[latex]g_{c}=\frac{{(V_{0})(k_{c})-D_{0}}}{{V_{0}+D_{0}}}[/latex]
All other values are then entered into the formula, and an implied kc or gd is calculated. If kc is higher than the appropriate benchmark value, then the asset is likely undervalued as its current price is based on too high of a risk level. Overtime, the price should rise as the kc falls to the appropriate benchmark as market inefficiencies are corrected. If gd is higher than the appropriate benchmark value, then the asset is likely overvalued as its current price is based on too high of a growth rate. Overtime, the price should decline as the gd falls to the appropriate benchmark as market inefficiencies are corrected. The analysis is reversed if the kc and gd are initially lower than the benchmark.
Business valuators may apply this technique to individual companies, entire industries, or the stock market as a whole to determine if they are over or under valued. Many investors do not purchase individual stocks, but instead buy or sell entire industries or stock indexes based on their assessment of whether they are mispriced.
7.3 | Income Approach – Free Cash Flows
Free Cash flow to Equity
The present value of dividends does not always accurately measure a firm’s value. Some companies do not pay dividends, while others pay dividends that are either well below or above what they should be paying for different reasons such as:
- Do not want to signal to the stock market that they are experiencing financial difficulties.
- Increase their financial flexibility by maintaining high cash reserves and a sub-optimal debt level.
- Reduce issuance costs by using retaining earnings only to fund growth.
- Retain cash for unprofitable investments and expensive management perks.
- Substitute stock repurchases for cash dividends to lower taxes paid by investors.
- Deceive the stock market into thinking their performance is better than justified.
To correct this problem, free cash flow to equity (FCFE) is substituted for dividends. FCFE is the residual cash remaining after a company pays for all its capital investments net of any financing. Agency theory says this cash should be paid out as dividends to the common shareholders since the company has no other positive net present value projects in which to invest. Shareholders can then redeploy this capital to other more profitable investments. FCFE is useful when an investor acquires a controlling position in another company as they have the ability to adjust the dividend to the level that maximizes shareholder value.
FCFE is calculated as:
[latex]\text{Formula 1 } FCFE=NI+NCC-\delta NWC-CE+NB[/latex]
Explaining the FCFE formula, net income (NI) is converted into cash flow by adding back non-cash charges (NCC) such as depreciation (D) and gains/losses on asset sales and deducting any change in net working capital (NWC). Capital expenditures (CE) are then deducted. Only a portion of CE are paid for in cash, so new debt minus principal payments or net borrowing (NB) is added back.
FCFE can also be calculated using two other equivalent formulas:
[latex]\text{Formula 2 }FCFE=CFO-CE+NB[/latex]
[latex]\text{Formula 3 }FCFE=NI-(CE-D)(1-DR)-\Delta NWC(1-DR)[/latex]
The formula 2 is equivalent as CFO includes adjustments for NCC and the change in NWC. Formula 3 is an algebraic manipulation of formula 1, except it only includes D instead of all NCC as it assumes D is the largest component of NCC which it is normally true.1 Multiplying by one minus the debt ratio (1 – DR) provides the portion of CE or the change in NWC that is paid in cash. Multiplying by (1 – DR) also allows valuators to use an estimate of the forward-looking debt ratio instead of the current NB.
Once FCFE is estimated for future periods, it can be substituted for dividends in the one-stage, two-stage, or three-stage growth models to calculate the value of the firm. Like dividends, FCFE is carefully estimated for each of the next three to five years and then more generally in subsequent periods. Proforma financial statements are prepared using the percentage of sales method based on a sales forecast. Inputs for any of the formulas can be taken from these proformas. These skills are developed in Module: Financial Planning and Growth and Module: Business Forecasting.
Applying the FCFE Model
Other factors to consider when applying the FCFE model include:
- Preferred shares are considered debt and not equity for valuation purposes so any dividends or sinking fund payment should be treated as interest and principal.
- CE and NWC needs will vary with growth in sales.
- CE are normally greater than D in the growth stage but this difference narrows and approaches zero as the company matures.
- Like DDM, small variations in inputs such as kc and gd result in significant differences in valuations, so great care should be taken estimating these variables. Sensitivity or scenario analysis are used to test the effect of any potential errors.
- If an investor acquires a controlling interest in another company, any potential synergies can be included in FCFE to determine the firm’s investment or acquisition value.
Free Cash Flow to the Firm
Some analysts feel using free cash flow to the firm (FCFF) produces a more accurate business valuation than FCFE. FCFF is the residual cash remaining for investors after making all investments in NWC and CE. Investors include not only common shareholders but debt holders and preferred shareholders as well. FCFF can be calculated using either of two equivalent formulas:
[latex]\text{Formula 1 }FCFF=EBIT(1-TR)+NCC-CE-\Delta NWC[/latex]
[latex]\text{Formula 2 }FCFF=CFO+(I)(1-TR)-CE[/latex]
The FCFF formula is similar to the formula for FCFE except interest (I) is removed from NI by using earnings before interest and taxes (EBIT) times one minus the tax rate (1- TR). NB is eliminated entirely as it relates to debt and preferred shareholders who are now considered investors. When FCFF is substituted for FCFE in the one-stage, two-stage, or three-stage growth models, the value of the firm or its enterprise value is from the perspective of all investors. Because of this, the discount rate used is the company’s weighted average cost of capital (WACC) and not its cost of common equity.
| [latex]WACC=(W_{d})\times(k_{d})+(W_{p})\times(k_{p})+(W_{c})\times(k_{c})[/latex] | |
| kd – Cost of debt | Wd – Weight of debt |
| kp – Cost of preferred shares | Wp – Weight of preferred shares |
| kc – Cost of common shares | Wc – Weight of common shares |
To determine the value of the firm to the common shareholders only, the market value of the company’s debt and preferred shares are then deducted.
The income approach based on FCFF is similar to using FCFE, but it has a number of advantages. FCFF is less likely to be negative due to the greater use of financial leverage (i.e. higher interest costs) or the cyclical nature of the business. If financial leverage is expected to change significantly in the near term, FCFF will be easier to estimate than FCFE. Also, WACC is more stable than the cost of common equity and reliable market values for debt and preferred shares are available if these securities trade in active secondary markets.
Special Applications of the Income Approach
- Non-operating assets. Dividends, FCFE or FCFF do not include the value non-operating assets such as idle land or excess cash since these assets typically do not generate income. A firm’s value should be increased by the fair market value of these assets. Marketable securities such as stocks or bonds do generate income, but a more accurate valuation can be obtained by removing any income from FCFE or FCFF and adding the market value of the securities to the value of the firm.
- Multi-unit businesses. For companies with a number of business units in different industries, valuing each of the units separately and then adding them together will likely provide a more accurate valuation.
- Cyclical companies. Using figures such as sales, net income, EBIT or CFO from a cyclical business without normalizing them over a full business cycle will result in serious valuation errors. When normalizing these amounts, valuators should not just average past values as they grow naturally due to changes in the size of the business. This can be addressed by scaling them using company average ratios. Income measures also vary overtime as the nature of the company changes or if it experiences one-time operational problems. The solution is to scale them using industry average ratios or rating firm results instead of relying on historical company data.
- Distressed firms. Companies experiencing financial distress are difficult to value. They have considerable debt so their FCFE is usually negative due to high debt servicing requirements. A two or three-stage FCFF module should be used to value these firms as FCFF is less likely to be negative than FCFE. Detailed projections for the initial turnaround period are prepared followed by a healthy, more stable growth period. If the company is expected to fail, then the liquidation value of individual assets and liabilities are used to value the business. Private equity firms called vulture capitalists specialize in buying bankrupt companies at the lowest price possible and then making a profit by turning them around or breaking them up.
7.4 | Market Multiples Approach – P/E, P/BV, and P/S
When using the market multiples approach to value a firm, a benchmark multiple is first calculated that relates share price (P) to a measure of financial performance such as earnings per share (EPS), book value per share (BVPS), or sales per share (SPS). The benchmark is then multiplied by the company’s historical or estimated future EPS, BVPS, or SPS to determine its appropriate share price. Finally, this price is multiplied by the number of common shares to calculate the intrinsic value (V0) of the firm.
[latex]V_{0}=\text{Benchmark }(P/EPS)(EPS)(\text{Number of common shares})[/latex]
[latex]V_{0}=\text{Benchmark }(P/SPS)(SPS)(\text{Number of common shares})[/latex]
[latex]V_{0}=\text{Benchmark }(P/BVPS)(BVPS)(\text{Number of common shares})[/latex]
Given the uncertainty of business valuations, analysts typically use more than one type of benchmark multiple to improve the accuracy of their results.
Price/Earnings (P/E) Multiple
A P/E multiple measures how much investors are willing to pay for each dollar of a company’s earnings. It is the most widely recognized and commonly used market multiple as earnings are the primary indicator of financial performance since it includes both revenues and costs. Over the long term, firms with low P/Es usually underperform the market while those with high P/Es outperform it.
Despite its popularity, using the P/E multiple to value a firm has a number of potential shortfalls. Many companies manipulate earnings to misrepresent their financial performance. Aggressive revenue recognition policies are adopted to record sales prematurely. Costs are reduced by excessive cost capitalization, altering accounting estimates like the bad debt percentage, or delaying discretionary costs such as advertising, maintenance or R&D. Companies may not intentionally manipulate their financial statements, but the wide choice of accounting policies under IFRS makes them less comparable to other firms. P/E multiples also vary over the business cycle especially with cyclical firms like automobiles that experience large swings in sales and may have high degrees of operating and financial leverage that cause profits to be even more variable. Finally, earnings can sometimes be small, zero or negative especially for start-up and cyclical companies which is illogical when incorporated into a P/E multiple.
To apply the market multiples approach using P/E, analyst must calculate a firm’s EPS and then the benchmark P/E multiple.
-
- Calculating EPS. EPS is calculated using either trailing EPS from the previous four quarters or leading or forward EPS estimated for the next four quarters. Leading EPS is preferable as it is forward looking and incorporates recent operational and financial changes such as a company expansion or a revision to its capital structure. Trailing EPS should be used if reliable future earnings estimates are not available.
- When calculating leading EPS, valuators can use their own earnings forecasts, forecasts of equity analysts who follow the company, or consensus forecasts of these analysts provided by financial information firms. The exact method used to calculate trailing and leading EPS varies among the information providers so analysts must ensure all earnings data is measured consistently. Diluted EPS which correctly includes the potential effect of convertible securities or options should be used.
- Earnings can be adjusted for aggressive revenue and cost recognition practices. Non-recurring accounting charges like discontinue operations, restructuring charges, and gains/losses on asset sales may also be eliminated so the P/E multiple reflects continuing earnings. Finally, adjustments can be made for differences in accounting policies adopted by companies such as LIFO versus FIFO inventory. LIFO is not allowed under IFRS, but it is still regularly used by U.S. companies. In practice, making these adjustments is difficult due to a lack of information in the company’s financial disclosures and it is also time consuming.
- Valuators typically normalize or average trailing EPS to compensate for the effects of the business cycle on earnings including losses. The two methods used include:
- Average historical EPS. Diluted EPS is averaged over the last business cycle.
- Average historical ratios. Rate of return on equity () is averaged over the last business cycle. This average ratio is then multiplied by the company’s current BVPS. BVPS cancels out leaving an estimate of EPS.
- [latex](\frac{{EPS}}{{BVPS}})BVPS=EPS[/latex]
- The average historical ratios method is preferred. If diluted EPS is normalized over the last business cycle, the older EPS figures will likely be smaller as they do not include the growth in the business over that period. Alternatively, ROE will not be affected by growth since both net income and shareholders’ equity rise as the business grows. Taking the average ROE over the last business cycle and then applying it to the current BVPS provides a more accurate measure of EPS. The opposite logic applies if a firm becomes smaller.
- To compare companies with small, zero or negative EPS, the earnings yield ratio $latex=\frac{{EPS}}{{BVPS}}) can be substituted for the P/E multiple. This allows valuators to rank companies based on their financial performance regardless of whether it is positive or negative.
- Calculating the benchmark P/E multiple. Once EPS is accurately measured, the benchmark P/E multiple is determined using one of the following methods:
- Justified P/E benchmark multiple based on fundamentals. The one-stage DDM is used to determine a firm’s justified P/E multiple. Substituting P0 for V0 in formula 1, both sides of the one-stage DDM are then divided by leading earnings per share (E1) in formula 2.
- [latex]\text{Formula 1 }P_{0}=\frac{{D_{1}}}{{k_{c}-g_{d}}}[/latex]
- [latex]\text{Formula 2 }\frac{{P_{0}}}{{E_{1}}}=\frac{{\frac{{D_{1}}}{{E_{1}}}}}{{k_{c}-g_{d}}}[/latex]
- Formula 2 indicates that the justified leading P/E multiple is a function of three fundamental factors kc, gd, and D1/E1 which is a company’s expected payout ratio. The higher the risk level of a company as measured by kc, the lower the P/E multiple. The higher the company’s growth rate as measured by gd, the higher P/E multiple. Additionally, the higher the payout ratio, the higher the P/E multiple. The justified trailing P/E multiple formula is slightly different, but it is a function of the same three factors.
- [latex]\text{Formula 3 }\frac{{P_{0}}}{{E_{0}}}=\frac{{\frac{{D_{0}}}{{E_{0}}}(1+g_{d})}}{{k_{c}-g_{d}}}[/latex]
- A firm’s justified P/E multiple is calculated by inputting estimates for these three fundamentals into either formula 2 or 3. The analyst then compares the company’s justified P/E multiple to its actual P/E ratio to decide whether the company is under, over, or fairly valued. Given the potential for estimating error, valuators typically establish a range of 5.0% around the justified P/E multiple. If a company’s P/E ratio falls in this range, they are considered fairly valued but otherwise they are either under or overvalued. Alternatively, the justified P/E multiple can be multiplied by leading EPS to estimate the firm’s value and the 5.0% range is used to establish an appropriate confidence interval.
- As discussed, if companies do not pay dividends or pay dividends that are well below or above what they should be paying, FCFE may be substituted for D. The two-stage and three-stage DDM can also be used to determine the justified P/E multiple for more complex multi-stage valuations where the fundamentals are expected to vary over the life of the business.
- Comparable companies. Companies with equivalent operational and financial characteristics should have similar financial ratios. As a result, the average or median P/E ratio for a carefully selected group of comparable companies (also called a peer group) should provide a reliable benchmark P/E multiple. Median values are typically used to eliminate the effect of outliers.Industrial classification systems determine groupings of comparable companies. One commonly used system is the Global Industry Classification Standard (GICS) sponsored by Standard & Poor’s and MSCI. This system classifies companies by sector, industry group, industry, and sub-industry with sub-industry being the most precisely defined category. Below is an example of how a company producing auto parts and equipment is categorized.
-
Exhibit 2: Global Industry Classification Standard
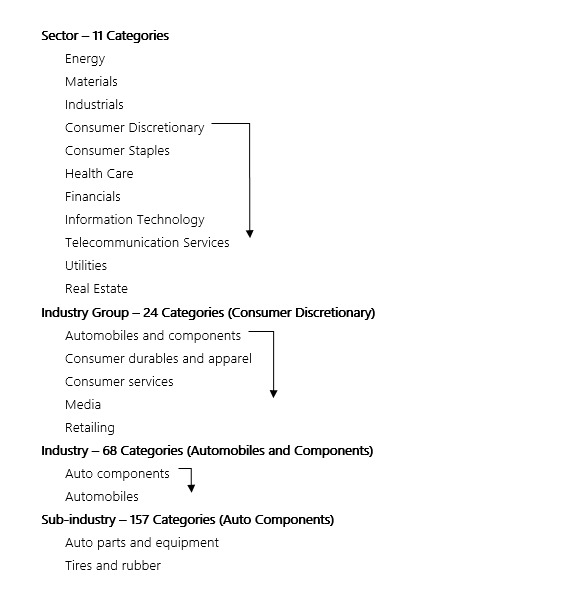
- To determine the most accurate benchmark P/E multiple possible, comparable companies should be selected from the relevant sub-industry group. If the number of companies in the sub-industry are insufficient to provide a reliable benchmark, the larger industry, industry group or sector grouping may be used although these companies will be less representative of the firm being valued. P/E multiples for the industry, industry group, sector, or the stock market as whole may be used for comparison if analysts feel a sub-industry is over or undervalued relative to the larger economy. Mispricing sometimes occurs due to market inefficiencies that affect the entire sub-industry such as the internet bubble in the early 2000s.
- A value investor may buy an undervalued share expecting that the firm’s P/E ratio will eventually rise to the mean or median P/E multiple of its peer group once any market inefficiencies correct themselves. Before taking investment action, investors should carefully consider whether there are good reasons for the firm’s lower P/E ratio. According to the justified P/E multiple formula, P/E is a function of the fundamental factors risk, growth, and dividend payout. A firm’s low P/E compared to its peer group may not be due to market inefficiencies, but higher risk, lower growth prospects, or reduced payout. This means the lower P/E ratio may be justified. The P/E-to-growth (PEG) ratio is commonly used with the comparable companies’ method to measure what investors are paying for growth to determine if a company’s current P/E ratio is reasonable or not. PEG is calculated as a firm’s PEG ratio divided by the expected percentage growth rate. A low PEG ratio in relation to the other comparable companies does not always indicate an undervalued share if there is a high level of risk or low payout.
- Multi-regression analysis. This method is used to measure the cause and effect relationship between P/E ratios and the three fundamental factors of risk, growth, and payout. Based on comparable companies from the same sub-industry, a multi-regression equation that estimates P/E based on these three factors is calculated. Estimates of growth, payout, and risk for the company are then inputted into the equation to determine the benchmark P/E multiple. The growth rate is typically the five-year expected growth rate of earnings or some proxy such as the growth rate of dividends or sales. Risk can be measured by a company’s kc, beta, or another volatility measure such as the coefficient of variation of earnings.
- In practice, the multi-regression approach is not widely used to estimate the benchmark P/E multiple. Low and unstable R squares, multi-collinearity between variables, and unstable regression coefficients with low confidence and incorrect signs are serious problems. Analysts attempt to correct for these concerns by eliminating variables that are multi-collinear, adopting more accurate measures of risk, growth, or payout or using industry, sector or market data instead of sub-industry data to increase the sample size.
- Historical average price multiples. If reliable comparable company data is not available, the benchmark P/E multiple can be calculated using the company’s own average or median P/E ratio over the last business cycle. By averaging the P/E ratio instead of EPS, changes in the business’ size are incorporated. Do not use this method if a firm’s business mix or level of financial or operational leverage has been altered as past data will not be representative of future performance.
Price/Sales (P/S) Multiple
Some analysts prefer the P/S multiple to the P/E multiple because sales are easier to estimate, never negative, more stable than earnings over the business cycle, and subject to less accounting manipulation. Sales should still be normalized for the business cycle and adjusted for aggressive revenue recognition practices to provide the most accurate valuation possible.
The main problem with the P/S multiple is it does not include operating expenses and interest making it a poorer measure of a business’ overall performance. The P/S multiple is effective though when valuing mature companies or firms with standardized operating procedures which results in similar cost structures. This is the case with franchises where P/S multiples are used to value individual outlets when they are traded between franchisees or with the franchisor. P/S multiples are also employed to value start-ups that are not yet generating profits.
Most valuation practices used with P/E multiples can also be apply to P/S multiples. When calculating the justified trailing P/S multiple, there is an additional fundamental factor. Formula 1 is the one-stage DDM. Formula 2 is a derivation of formula 1 that shows DPS is equivalent to EPS times the payout ratio. Because current values are used for earnings and payout, the expected growth rate is applied. In Formula 3, both sides of the formula are divided by SPS. EPS divided by SPS is the NPM.
[latex]\text{Formula 1 }P_{0}=\frac{{D_{1}}}{{k_{c}-g_{d}}}[/latex]
[latex]\text{Formula 2 }P_{0}=\frac{{E_{0}\times \frac{{D_{0}}}{{E_{0}}}\times (1+g_{d})}}{{k_{c}-g_{d}}}[/latex]
[latex]\text{Formula 2 }\frac{{P_{0}}}{{S_{0}}}=\frac{{NPM_{0}\times \frac{{D_{0}}}{{E_{0}}}\times (1+g_{d})}}{{k_{c}-g_{d}}}[/latex]
The justified P/S multiple is a function of NPM in addition to risk, growth, and payout.
Price/Book Value (P/BV) Multiple
Some analysts prefer the P/BV multiple to the P/E multiple because BV is nearly always positive, is more stable over the business cycle, and is harder to manipulate. The main problem with this multiple is that many assets and liabilities are recorded at historical cost instead of fair market value, while other assets such as patents that are developed internally or off-balance sheet financing such as take-or-pay contracts are not included in the balance sheet at all. For the best results, book value should be re-calculated to include all recognized and unrecognized assets and liabilities measured at their fair market value. This is difficult in practice because of limited company financial disclosures and some intangible assets such superior employees, strong customer service, or superior product quality are very difficult to measure. Finally, the P/BV multiple is not suitable for service firms who have few fixed assets or companies in sub-industries with large differences in cost structure due to varying degrees of labour or capital intensity. Remember that preferred shares and any preferred dividends in arrears need to be removed from book value as only common equity is being valued.
Justified trailing P/BV multiple is a function of ROE plus risk, growth, and payout. Formulas 1 and 2 are the same as for the P/S multiple. Formula 3 is a derivation of formula 2 that shows E is equivalent to BV times ROE [latex]\frac{{E}}{{BV}}[/latex]. In formula 4, both sides of the formula are divided by BV leaving the four factors.
[latex]\text{Formula 1 }P_{0}=\frac{{D_{1}}}{{k_{c}-g_{d}}}[/latex]
[latex]\text{Formula 2 }P_{0}=\frac{{E_{0}\times \frac{{D_{0}}}{{E_{0}}}\times (1+g_{d})}}{{k_{c}-g_{d}}}[/latex]
[latex]\text{Formula 3 }P_{0}=\frac{{BV_{0}\times ROE_{0}\times \frac{{D_{0}}}{{E_{0}}}\times (1+g_{d})}}{{k_{c}-g_{d}}}[/latex]
[latex]\text{Formula 4 }\frac{{P_{0}}}{{BV_{0}}}=\frac{{ROE_{0}\times \frac{{D_{0}}}{{E_{0}}}\times (1+g_{d})}}{{k_{d}-g_{d}}}[/latex]
7.5 | Market Multiples Approach – P/CF and EV/EBITDA
Other benchmark market multiples provide a more accurate business valuation by addressing some of the problems with traditional P/E, P/S, and P/BV multiples.
Price/Cash Flow Multiple
Some valuators replace EPS in the P/E multiple with a firm’s cash flows as this amount is more stable, less likely to be negative, subject to less manipulation, and not affected as much by a firm’s choice of accounting policies. Different measures of operating cash flows include:
- Earnings before interest, taxes, depreciation and amortization (EBITDA). EBITDA provides a quick approximation of operating cash flows by adding back depreciation and amortization to EBIT. These are typically a firm’s largest non-cash expenses. Using EBITDA is not recommended as it does not include interest and taxes which are major cash items, nor does it adjust for changes in NWC and other non-cash transactions such as gains and losses on asset sales.
- Cash flows from operations. CFO is given on the statement of cash flows and is a more accurate measure of operating cash flows than EBITDA. It can be manipulated as IFRS gives considerable discretion in classifying certain transactions allowing firms to exaggerate CFO. Normally interest paid and interest and dividend income received are classified as operating activities as they are included in the determination of net income. Interest paid can also be classified as a financing activity as it is a cost of financing which increases CFO. Interest and dividends received may be classified as investing activities as they are investment returns which lowers CFO. Dividends paid are normally classified as a financing activity because they are a cost of financing. They may be classified as an operating activity to assist users in determining an entity’s ability to pay dividends out of operating cash flows which lowers CFO.
- To manipulate CFO, companies can capitalize additional costs as inventory or fixed assets, so they appear as investing and not operating activities. Over the short-term, they can also defer payments on accounts payable, delay discretionary costs such as advertising, maintenance, and R&D, reduce inventory purchases, or accelerate accounts receivable collections using expensive cash discounts or factoring.
- Under US GAAP, interest paid and interest and dividend income received must be included in operating activities while dividends paid are always classified as financing activities. This provides a more accurate measure of the cash return for common equity holders and should be used for valuation purposes. These amounts must be disclosed separately under IFRS so analysts can easily reclassify them when valuing a firm. Other adjustments relating to the manipulation of CFO and non-recurring items should be made if the needed information is available.
- The justified trailing P/CFO multiple is a function of risk, growth and D/CFO. D/CFO is another dividend payout measure that is based on cash flows from operations.
- [latex]\frac{{P_{0}}}{{CFO_{0}}}=\frac{{\frac{{D_{0}}}{{CFO_{0}}}(1+g_{CFO})}}{{k_{c}-g_{CFO}}}[/latex]
- Free cash flow to equity. FCFE improves on CFO by including capital expenditures (CE) net of any borrowing (NB). They are a firm’s total cash flows and not just the operating cash flows available to equity investors. One of the formulas for FCFE is:
- [latex]FCFE=CFO-CE+NB[/latex]
- Because CE and NB vary considerably from year-to-year, FCFE is usually more variable than CFO. These amounts should be normalized over the business cycle.The justified trailing P/FCFE multiple is a function of risk and growth. As discussed, D and FCFE should be equivalent.
- [latex]\frac{{P_{0}}}{{FCFE_{0}}}=\frac{{(1+g_{FCFE})}}{{k_{c}-g_{FCFE}}}[/latex]
Economic Vlaue/EBITDA Multiple
Instead of using a firm’s share price in a market multiple, some valuators substitute enterprise value (EV). EV is the market value of its common equity, preferred shares and debt minus any cash, cash equivalents and short-term investments. It is the value of the firm to all investors which includes both the debt and equity holders. Cash, cash equivalents, and short-term investments are deducted as they are not needed in the operation of the business and can be used to buyout current debt and equity investors thus lowering the cost of the acquisition or value of the firm. EV is then divided by EBITDA which approximates operating cash flows available to debt and equity holders as it is EBIT before interest plus taxes, depreciation, and amortization.
EV/EBITDA is a useful multiple because it is capital structure neutral. This means it excludes the effect of financial leverage by not including interest which is important if the use of debt varies substantially between comparable companies. EV/EBITDA is also capital intensity neutral as it excludes depreciation and amortization which is important if the comparable companies have different fixed cost structures. Reliable market values are typically available for debt and preferred shares, so once EV is determined using the benchmark EV/EBITDA multiple then the value of these securities is deducted to determine the value of the common equity.
FCFF is preferable to EBITDA because it correctly measures all of a firm’s cash flows and not just the operating cash flows available to debt and equity holders. One of the formulas for FCFF indicates:
[latex]FCFF=CFO+(I)(1-TR)-CE[/latex]
FCFF begins with CFO but then capital expenditures (CE) are deducted. Interest (I) is added back on an after-tax basis and net borrowing (NB) is not included because they relate to the debt holders. As discussed in the income approach using FCFF section, EV is equal to the present value of a firm’s future FCFF:
[latex]EV_{0}=\frac{{FCFF_{0}(1+g_{FCFF})}}{{WACC-g_{FCFF}}}[/latex]
WACC is the appropriate discount rate since FCFF is available to both debt and equity holders. Again, to determine the value of the firm to the common shareholders only, the current market value of the company’s debt and preferred shares are deducted.
The justified trailing EV/FCFF multiple is a function of risk and growth.
[latex]\frac{{EV_{0}}}{{FCFF_{0}}}=\frac{{(1+g_{FCFF})}}{{WACC-g_{FCFF}}}[/latex]
7.6 | Asset-Based Approach
The asset-based approach values a company by taking its historical cost balance sheet and restating all its assets and liabilities at their fair value. The difference between total assets and liabilities is the fair market value of the business. This approach is used sparingly because of the difficulty valuators have accurately pricing non-financial assets including land, building, equipment, and particularly intangible assets and goodwill. Also, more information is generally available about an entire business operating as a going concern than its individual assets and liabilities. With IFRS, more assets and liabilities are now recorded at fair value instead of historical cost which makes this method simpler to apply.
The asset-based approach is best used to value four types of companies. These include 1) distressed companies where the fair market value of their net assets is usually more than their value as part of a going concern, 2) financial institutions and investment funds whose assets are largely financial and can be more accurately valued individually as they typically trade in active secondary markets, 3) resource and real estate companies whose main assets are properties with objectively determinable outputs, and 4) small, privately traded start-up companies where estimating future cash flows is difficult and few intangible assets or goodwill exists.
Steps in Applying the Asset-Based Approach
- Step 1 Obtain a historical cost-based balance sheet
- Step 2 Identify any off-balance sheet assets and liabilities including:
- Unrecorded tangible or intangible assets
- Contingent liabilities
- Non-capitalized leases
- Other off-balance sheet assets and liabilities
- Step 3 Measure all assets and liabilities at fair value if material
- Step 4 Estimate the fair value of any goodwill
- Step 5 Construct a fair value-based balance sheet
Valuation Methods
Different methods can be used to determine the fair value of assets and liabilities.
- Financial assets and liabilities. These assets and liabilities derive their value from a contractual claim or obligation involving cash and frequently trade in active secondary markets. Under IFRS, these assets and liabilities are usually recorded at fair value already. If not, they should be recorded at the present value of their future cash flows using a discount rate that reflects the riskiness of the asset or liability. Any allowances for doubtful accounts should be re-assessed as part of the valuation process.
- Inventory. These assets can be valued at either replacement cost or net realizable value (NRV). Replacement cost is what a company would currently pay to replace an asset with another asset in similar condition. NRV is what the inventory can be sold for less any costs to complete and dispose of the asset.
- Long-term assets. These assets, which include land, building, equipment and intangibles, are valued using either the market, income or cost approaches. The market approach reviews recent sales of similar assets and adjusts for differences in the quantity and quality of output. The income approach estimates an asset’s future cash flows and determines their present value using a discount rate that reflects the riskiness of the asset. The cost approach looks at what is would cost to buy or build a replacement asset with a similar quantity and quality of output.
- Goodwill. This is the portion of a business’ value that is not attributable to specific tangible or intangible assets. It results from superior operating performance and the ability to produce innovative, high-quality goods and services. Under IFRS, goodwill is only recorded when purchased based on the objectivity principle. Companies who frequently engage in acquisitions have considerable goodwill while those that avoid acquisitions do not. Goodwill is also not regularly amortized under IFRS, but it is written down when the cash-generating unit the goodwill relates to is written down. This means that the value of a company’s goodwill is unreliable and should be re-assessed when using the asset-based approach.
- Goodwill is valued at the present value of a company’s excess earnings.
- [latex]\text{Excess earnings }=FCFF-(\text{Net assets})(WACC)[/latex]
- Excess earnings are the additional profits a company actually earns compared to what it should earn given the assets it employs and their required rate of return. As discussed, FCFF is what a company earns from the perspective of both debt and equity investors. Net assets consist of long-term assets plus net working capital. WACC is the required rate of return of debt and equity investors. Instead of using the WACC, separate required rates of return for net working capital, fixed assets and intangibles may be estimated. The rate for net working capital would be the lowest given its lower risk as an asset class, followed by fixed assets, and then intangible assets. The weighted average of these separate required rates of return should approximate the WACC. In practice, these individual rates are not readily available, so WACC is used for all asset classes.Valuators can assume that the excess earnings will last indefinitely or only for a finite period of time. Excess earnings are likely to attract competition, so unless the industry has high barriers to entry, a finite period should be adopted.
7.7 | Residual Income Approach
Some managers feel that if a firm is profitable it is creating value for its investors. This is incorrect because although net income (NI) includes interest expense that fairly compensates debt holders, there is no deduction for the cost of common equity. If NI is insufficient to meet the shareholders’ required rate of return (RRR), the company is actually destroying value. Consider the following company after its first year of operations:
Exhibit 3: Destroying Shareholder Value
| BV | CAD 250,000 |
| Number of common shares | 10,000 |
| P0 at the beginning of the year | CAD 25.00 |
| P0 at the end of the year | CAD 18.75 |
| NI | CAD 18,750 |
| EPS | CAD 1.875 |
| RRR (kc) |
10.0% |
Shareholders invested CAD 250,000 and expected to make at least CAD 25,000 (CAD 250,000 × 0.10) in the first year. NI was only CAD 18,750, so equity investors received CAD 6,250 (CAD 25,000 – CAD 18,750) less than required. In percentage terms, the firm generated a ROE of 7.5% (CAD 18,750 / CAD 250,000) but investors required 10.0%. The company did not generate an adequate return to compensate its shareholders and thus destroyed value. If investors continue to receive CAD 6,250 less than required in perpetuity, a total of CAD 62,500 (6,250 ÷ 0.10) or CAD 6.25 per share (CAD 62,500 / 10,000) will be lost. The company’s share price fell from CAD 25.00 to CAD 18.75 (CAD 25.00 – CAD 6.25) to reflect this poor performance. Any new investors buying into the company will now receive the required return of 10.0% (1.875 ÷ 18.75) due to the decline in share price. A company’s share price will rise and fall so investors always earn the RRR in efficient markets.
Residual income (RI) is the difference between a company’s NI and its shareholders’ RRR. If this amount is positive, the firm is creating value and its share price will rise above its BVPS. If RI is negative, the share price will fall below BVPS as the firm is destroying value. If the firm generates no RI, it BVPS should approximate its share price. The following equivalent formulas demonstrate this relationship and the different ways to calculate RI:
[latex]V_{0}=BVPS_{0}+\sum\limits_{t=1}^\infty \frac{{RI_{t}}}{{(1+k_{c})^{t}}}=BVPS_{0}+\sum\limits_{t=1}^\infty \frac{{EPS_{t}-k_{c}BVPS_{t-1}}}{{(1+k_{c})^{t}}}=BVPS_{0}+\sum\limits_{t=1}^\infty \frac{{(ROE_{t}-k_{c})BVPS_{t-1}}}{{(1+k_{c})^{t}}}[/latex]
The current P/BV ratio for the S&P 500 is 3.58 indicating that on average the 500 largest U.S. public companies are creating value.
RI is also referred to an economic profit, excess earnings, abnormal profits or economic value added (EVA)®. EVA is a registered trade mark of Stern Stewart & Company, a U.S-based consulting firm that publishes a set of adjustments to earnings and book value in order to provide a more accurate measure of RI. These adjustments are similar to those discussed for the P/E and P/BV multiples. Besides business valuation, residual income is also used internally by companies to measure business unit performance and determine appropriate levels of executive compensation. This is discussed in the Module: Financial Statement Analysis.
Valuing Equity Using the RI Approach
The intrinsic value (V0) of a company can be estimated using a one-stage, two-stage or three-stage RI model. The one-stage model is used if valuators expect the firm’s ROE and other inputs will remain constant. The formula is modified as follows:
[latex]V_{0}=BVPS_{0}+\frac{{(ROE-k_{c})BVPS_{0}}}{{k_{c}-g}}[/latex]
The one-stage model is of limited value because ROE is usually not stable. If a firm’s ROE is above its kc, it will likely revert to kc over time as new competitors enter the market and eliminate any excess profits. Alternatively, if a firm’s ROE is below its kc, it may rise over time as competitors leave the market. Finally, if its kc is expected to consistently exceed its ROE, the firm should be liquidated and its assets redeploy to other investments that create shareholder value. Valuators normally assume a ROE above kc in the initial stage that reverts to kc in the terminal period.
The RI approach has a number of advantages and disadvantages compared to the other valuation methods. It is more easily applied to companies that do not pay dividends or whose cash flows are unstable. It focuses on profitability which some valuators feel is a more accurate measure of a firm’s performance than dividends or cash flows because it is smoother over time. It uses readily available accounting data, although adjustments should still made to eliminate aggressive accounting policies, report assets and liabilities at their fair value, and remove non-recurring or unrelated items. Finally, the firm’s terminal value makes up a very small portion of its intrinsic value unlike the income approach based on dividends or cash flows. This is because the valuation formula for the RI approach begins with a firm’s BVPS and then adds the present value of RI to determine its intrinsic value. These RI amounts are more recent so they are easier to estimate accurately compared to a firm’s terminal value. The RI approach typically assumes a terminal value of zero as the firm’s ROE reverts to it kc over time resulting in no RI.
Final Valuation
Business valuation is an imprecise process. Instead of relying on just one approach, most analysts employ a number of different valuation methods to improve the accuracy of their results. Some methods may be eliminated because their inputs are difficult to estimate or the final results are outliers. A weighted average of the remaining valuations is then calculated.
Exhibit 4: Weight-Average Valuation
| Method | Estimate
(CAD) |
Weight |
| DDM | 43.62 | 25% |
| FCFE | 36.42 | 30% |
| FCFF | 44.09 | 25% |
| P/E | 51.33 | 10% |
| P/BV | 53.87 | 10% |
| Firm Value | 43.37 | 100% |
The weights are subjectively determined and greater emphasis is placed on the methods an analyst feels are more reliable. The usefulness of a particular valuation approach varies with a firm’s position in the company life cycle.
- Development stage. Asset-based approach is best as these companies do not pay dividends and their future cash flows are difficult to determine due to a lack of historical data.
- Growth stage. Residual income or income approaches using either FCFE or FCFF are favoured as rapidly growing cash flows can be more precisely estimated.
- Mature stage. Market multiples approach is preferred as growth is limited and industry relationships are well established making company comparisons more accurate.
7.8 | Control Premium, Marketability Discount, and Private Firms
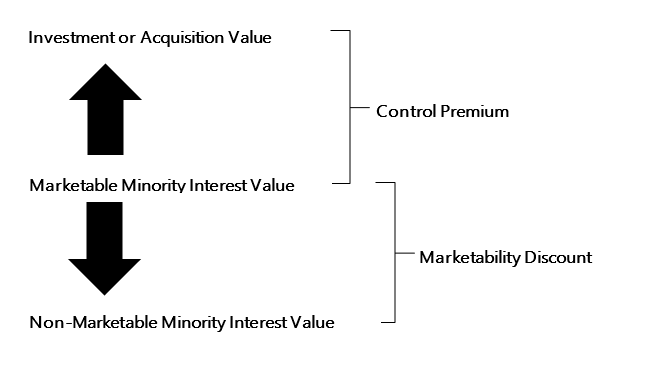
The business valuation process is not complete when the value of a company is determined using the income, market multiples, asset-based or residual income approaches. This value, which is referred to as the marketable minority interest value, may have to be adjusted upward or downward to incorporate a control premium or marketability discount.
Exhibit 5: Control Premium or Marketability Discounts
Control Premium
A control premium is the additional consideration a buyer will pay a seller over the marketable minority interest value to acquire a controlling interest. Investors with a controlling interest can make improvements to the company’s operations that a minority investor cannot resulting in synergies that increase the value of the firm.
Factors that increase potential synergies and the size of the control premium include:
- Poor management.
- Weak corporate governance.
- Excessive executive compensation and management perks.
- Ability to increase revenues and realize cost efficiencies.
- High discretionary expenses such as advertising that can be quickly reduced.
- Non-optimal use of financial leverage.
- Low dividend payout resulting in unprofitable investments and large amounts of low-yielding, non-operating assets such as excess cash or real estate.
- Supermajority voting rules or weak non-controlling shareholder rights that entrench management and limit the likelihood of an acquisition.
- Holding the balance of power between two competing shareholder groups which is called a swing vote premium.
Control premiums average from 20% to 30% based on studies of share prices before and after corporate acquisitions. Acquisitions can be very lucrative for buyers as long as they do not over pay and give all the synergies to the seller. When the control premium is expressed as a percentage of a firm’s investment or acquisition value, it is referred to as a non-control discount. The topic of synergies and control premiums, which are also called take-over premiums, are important issues in Module: Mergers & Acquisitions and Corporate Restructuring.
Marketability Discount
A marketability discount is the reduction in the marketable minority interest value a buyer receives to fairly compensate them for the lack of a ready market for their shares. Marketability is not usually a problem for public companies whose shares actively trade in secondary markets, but it is for private firms whose shares are much less liquid. Marketability discounts typically range from 40% to 60% based on studies of share prices before and after initial public offerings. Going public is lucrative for shareholders in private companies due to the elimination of the marketability discount.
Liquidity is not the only factor that influences the size of a marketability discount. Any factor that makes a private company’s shares less appealing to potential buyers will increase the marketability discount. Many of these factors are measured separately and have their own names. Some examples include:
- Low prospect of a public offering or business sale by the owners.
- High share issuance costs reducing the willingness to go public.
- Small firm size limiting its access to capital which raises the cost of borrowing.
- Weak performance due to poor governance and public financial oversight.
- Concentrated share ownership leading to abuses of power when dealing with minority investors.
- Limited access to financial information making it difficult for investors to monitor the company’s performance.
- Low or infrequent dividends indicating low company profitability or agency problems such as excessive management pay or perks.
- Ownership of a large block of the shares that are more difficult to sell which is called a blockage discount.
- Small pool of potential buyers that are interested in buying the shares.
- Provision preventing investors from selling their shares for a specific period of time after an initial public offering to support the share price which is called a lock-up agreement.
- Limited management depth so the departure of key staff exposes the company to considerable risk which is called a key-person discount.
- Greater difficulty attracting strong managers due to lower salaries and fewer career opportunities within the firm.
- Limitations on the rights of certain shareholder groups such as non-voting shares which is called a restrictive shareholder agreement discount.
- Actions are highly influenced by tax planning strategies and not their business merit.
A private company does offer some advantages that help reduce the marketability discount. They are leaner and more flexible than public firms because of their limited access to resources and smaller size. A private firm is not as focused on short-term earnings and share price performance due to a lack of public oversight enabling them to concentrate more on long-term growth. Finally, agency costs may be lower as managers are also owners and will only hurt themselves if they choose not to maximize share price.
Valuing Private Companies
The income, market multiples, asset-based, residual income approaches can also be used to value private companies, but there are a number of limitations due to the unique nature of these enterprises.
- Financial information quality. Before using accounting information to value a business, its earnings should be normalized to smooth out the effects of the business cycle, eliminate aggressive accounting policies, and remove any non-recurring or unrelated items. Assets and liabilities should also be reassessed at their fair market value. This is more difficult to do for a private company since their financial statements are generally not subject to a full audit by a qualified public accounting firm. They typically receive a less rigorous review engagement or compilation which provides a lower level of assurance and less detailed financial statement notes. In Canada, private companies use a simplified set of accounting standards called Accounting Standards for Private Enterprises (ASPE) that do not provide as detailed disclosures as IFRS.
- Private companies typically engage in numerous non-arm’s length transactions with their majority owners who may abuse their control positions to benefit themselves at the expense of their minority investors. Excessive salaries, lavish expense accounts, shareholder loans, life insurance policies, personal vehicles, and private residences may be received by the majority owners as well as their family members and friends who are employ by the firm. Frequently, a private company owns assets that it does not use but it still pays all the expenses for the majority owner. In other cases, the majority owner may lease their private assets to the company at an above market rate. Sometimes, the majority owner may work for less than the market rate, allow their firm to use their personal assets or lend it money at below market rates.
- To properly value a private firm, earnings should be normalized to adjust for these questionable non-arm’s length transactions. Excessive pay and perks should be eliminated especially for friends and relative who are employed by the business but do little work. Assets that are not used by the business should be removed from the financial statements along with any income they produce and retreated as non-operating investments. If the assets are used, they should be recorded at their fair market value and depreciated appropriately. If assets are rented from the majority owners, a lease agreement should be capitalized at the market interest rate and appropriate amounts of interest and depreciation expense recognized.
- Financial projections. Many private firms are small businesses in the early stages of their development, which makes forecasting their future performance very difficult. Company managers are likely the most knowledgeable about the firm’s potential but they are less experienced preparing financial projections and their forecasts tend to be either overly optimistic or pessimistic. Valuators should utilize this valuable source of information but be very cautious. Given the high level of uncertainty, valuators may employ scenario analysis when valuing companies instead of relying a single (i.e. most-likely) estimate of future operations. For start-ups, the scenarios could include a successful initial public offering, acquisition by another firm, continued operation by the owner as a private company, or liquidation if the business fails. For established private companies, scenarios may be constructed for different levels of growth and profitability. Each option is valued using different cash flow estimates and a cost of capital that reflects its riskiness. A probability is assigned to each scenario and an expected value is determined.
- Cost of capital. As discussed in Module: Cost of Capital, a private firm’s cost of capital is difficult to estimate using CAPM due to a lack of market data needed to calculate beta. Research also shows that CAPM does not measure risk as accurately for small companies as it does for larger firms. Small and medium-sized enterprises have been found to have higher costs of equity due to their limited financial power and other factors. To address this problem, some private firms estimate their beta using comparable public companies, accounting beta, or regression analysis and then apply a size premium to CAPM that varies for micro-cap, low-cap, and mid-cap firms. Others do not use CAPM and beta and instead employ the build-up approach which calculates kc as:
- [latex]k_{c}=\text{Risk-free rate }+\text{Market risk premium }+\text{Size premium }+\text{Industry risk premium }+\text{Company risk premium}[/latex]
- When valuing private company acquisitions, valuators should remember that a firm’s cost of equity, cost of debt, and optimal debt-to-equity ratio are dependent on the risk level of the firm being acquired and not that of the acquiring firm. Just like equity, the cost of debt will be higher for a smaller private firm due to its limited financial power. Its debt-to-equity ratio is lower due to reduced borrowing ability.
- Comparable data. Reliable market multiples are difficult to obtain for private companies. Three methods are used to value private companies using the market multiples approach:
- Guideline public company method. This method is based on recent trading in the shares of comparable public companies. Transaction data is readily available but valuators must adjust multiples so they are comparable to the private firm in terms of that company’s specific risk level, growth prospects, or stage of development. This is a subjective process that creates considerable potential for error. Transactions are between minority investors in public markets, so they measure a firm’s marketable minority interest value. A marketability discount should then be applied to determine the non-marketable minority interest value.
- Guideline transaction method. This method is similar to the guideline public company method, except it uses price multiples based on acquisitions of private or public companies only. Because investors are acquiring a controlling interest, the price is the investment or acquisition value of the firm which includes any control premium.
- Prior transaction method. This method uses past transactions in the private company’s shares to determine an appropriate market multiple. If there has been considerable trading among minority investors or with venture capitalists providing different rounds of financing, these transactions may be reliable. But typically, they are few in number, out-of-date, or between non-arm’s length parties making any multiples suspect. Adjustments can be made to help address these problems, but this process is subjective. Most past transactions are between minority investors in a private company, so this method estimates the non-marketable minority interest value.
7.9 | Professional Designations
There are two professional designations available in Canada for those interested in a career in business valuations.
- Chartered Business Valuator. These professionals focus on valuing individual transactions, assets, liabilities or entire business enterprises as well as litigation support which includes quantifying business damages arising in legal disputes and providing expert testimony at trial if required. Most CBVs in Canada are also CPAs who work primarily as associates or partners in public accounting firms providing business valuation and other accounting services including business advisory, taxation, financial reporting and insolvency. Candidates usually complete their CPA first, and then pursue a CBV designation to expand their skill set. Public accounting firms provide excellent mentorship opportunities for candidates and give them the opportunity to participate in a variety of complex valuation engagements. After becoming a CBV, some members join firms specializing in business valuations, while others work as self-employed contractors.
- To be accepted into the CBV program, candidates must have a degree or hold either a CPA or CFA designation. To earn a CBV, candidates must:
-
- Complete six courses
Level I – Introductory Business Valuation
Level II – Intermediate Business ValuationLevel III – Advanced Business ValuationLevel IV – Special Topics in Business ValuationTwo electives from the following:Litigation Support in Business ValuationCorporate FinanceValuation for Financial ReportingPrivate Investments - Acquire a minimum 1,500 hours of suitable experience
- Pass the Membership Qualification Exam (MQE)
- Complete six courses
- The 1,500 hours of work experience must contain at least 750 hours of Core Valuation Experience. According to the CBV Institute, this experience “… involves activities in connection with business valuation, corporate finance, private investments, and litigation support, where a conclusion as to the value related to a business, or where a conclusion of economic loss is reached.” The remaining hours consist of Non-Core Valuation Experience and are activities in similar areas that do not result in a conclusion of value. The MQE is four hours in length and is held every September. Candidates must complete their work experience within three years of writing the MQE to qualify for the designation. CPAs, CFAs and graduates of some university courses in business valuations receive program exemptions.
- Chartered Financial Analyst. CFAs manage the investment portfolios of high net worth individuals or institutions such as pension funds, endowments, insurance companies or mutual funds and are experts in the different areas of investing including equities, fixed income, and alternative investments like real estate, venture capital, and private equity. They are also skilled in risk management and hedging against commodity price movements, currency fluctuations, and credit risk. CFAs, unlike CBVs, focus primarily on the valuation of financial securities.To be accepted into the CFA program, candidates must normally have a degree, but are allowed to enroll in and complete the first level of the program before graduating. They are also admitted if they have a combination of four years of post-secondary education and full-time work experience in an investment or non-investment area.To earn the CFA designation, candidates must complete three levels of study over a three-year period and pass a six-hour exam at the end of each level. The program requires well over 900 hours of self-study in 10 topical areas including ethical and professional standards, quantitative methods, economics, financial reporting and analysis, corporate finance, equity investments, fixed income, derivatives, alternative investments and portfolio management and wealth planning. The curriculum is based on an ongoing analysis of what practicing professionals feel is needed to succeed in the competitive investment industry.To assist candidates in preparing for the very rigorous exams, the CFA Institute provides detailed online curriculum and other learning resources such as end-of-reading problems and mock exams. A number of private educational companies also provide preparation courses and practice exams to supplement what the CFA Institute offers. Before receiving their professional designations, candidates must complete 4,000 hours of qualified work experience and receive letters of reference from three professionals who attest to their experience and character. Compared to an MBA or masters of finance, the CFA is a very affordable program that allows working professionals to complete a graduate-level credential in finance without taking time off work.
1Proof:
[latex]\text{FCFE}=\text{NI}+\text{Dep}-\Delta \text{NWC}-\text{CE}+\text{NB}[/latex];
[latex]\text{FCFE}=\text{NI}-(\text{CE}-\text{D})-\Delta \text{NWC}+\text{NB}[/latex];
[latex]\text{NB}=(\text{CE}-\text{D})(1-\text{DR})+\Delta \text{NWC}(1-\text{DR})[/latex];
[latex]\text{FCFE}=\text{NI}-(\text{CE}-\text{D})-\Delta \text{NWC}+(\text{CE}-\text{D})(1-\text{DR})+\Delta \text{NWC}(1-\text{DR})[/latex];
[latex]\text{FCFE}=\text{NI}-(\text{CE}-\text{D})(1-\text{DR})-\Delta \text{NWC}(1-\text{DR})[/latex]
7.10 | Exercises
A. Suitability of Income Approach (DDM) at Quesnel
Cathy Parsons is an equity analyst for Quesnel Investments who has been asked to evaluate Little Fort and Clearwater for possible inclusion in the company’s value fund. She collected the following data:
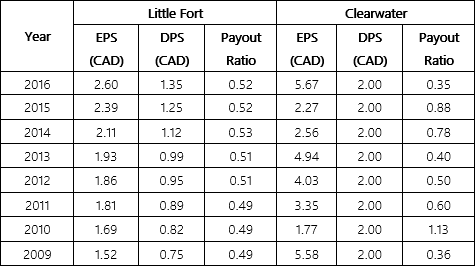
REQUIRED:
- Is the income approach (DDM) suitable for valuing these two companies?
B. Income Approach (DDM) at Rebel
Rebel Company is considering issuing additional equity to finance its expansion. The market price of its common share is currently CAD 110, but the company would like to verify this price to determine if it is a suitable time to raise new financing. The following data is available:
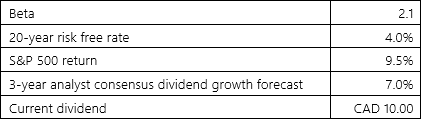
Rebel assumes a long-term dividend growth rate of 3.0%.
REQUIRED:
- Estimate the intrinsic value of Rebel’s shares using a 2-stage income approach (DDM). Should Rebel issue new shares now?
- Rebel is uncertain of some of its inputs and has decided to do a best and worst-case analysis using the following data:
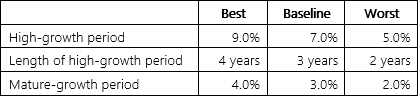
Will this analysis change Rebel’s decision?
C. Income Approach (DDM) With No Growth at Roanoke
Roanoke Ltd. has recently issued 3.5%, cumulative preferred shares with a par value of CAD 100.00. Roanoke’s cost of preferred share financing is 9.22%.
REQUIRED:
- What is the intrinsic value of Roanoke’s preferred shares using a 1-stage income approach (DDM)?
D. Income Approach (DDM) With Negative Growth at Klondike
Klondike Ltd. operates a gold mine in British Columbia. Its common shares currently pay an annual dividend of CAD 2.50 per share which is expected to decline in perpetuity by 5.0% annually based on historical data as the mine property is depleting.
Klondike has a beta of 1.3 and the market risk premium is estimated to be 5.5% and the 20-year government bond rate is 4.0%.
REQUIRED:
- What is the intrinsic value of Klondike’s shares using a 1-stage income approach (DDM)?
E. Estimating Historical Growth Rates
Kevin Simpson is an equity analyst who is considering Shamrock Systems for inclusion in his firm’s large cap fund. In order to estimate the growth rate of dividends in the income approach (DDM), Simpson has collected the following historical earnings per share data for the last two business cycles:
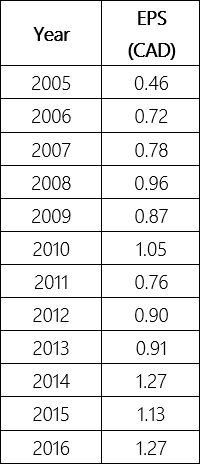
REQUIRED:
- Calculate the arithmetic and geometric mean growth rate of EPS from 2005 to 2016. Why should the geometric mean growth rate be used?
- Re-calculate the geometric mean growth rate using regression smoothing. Describe two advantages of this approach?
F. Income Approach (DDM) at Amsterdam
Amsterdam Company is preparing a fairness opinion in response to an offer it has received to buy the company. The following information was collected:
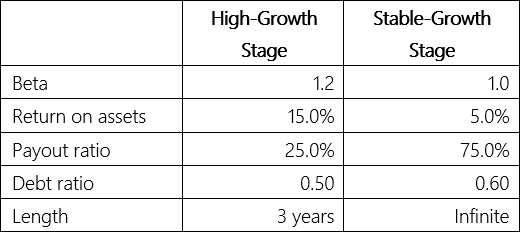
EPS was CAD 4.50 in the previous year. The risk-free rate is 4.5% and the market risk premium is 5.5%.
REQUIRED:
- Estimate the intrinsic value of Amsterdam’s shares using the 2-stage income approach (DDM).
- What percentage of Amsterdam’s intrinsic value is accounted for by its terminal value? Does this create any problems with the valuation?
G. Income Approach (DDM) at Samantha
Hal Wipley is the owner of Samantha Company and has hired Jenna Walters, CBV to value his firm as he is contemplating retirement. Walters made the following estimates:
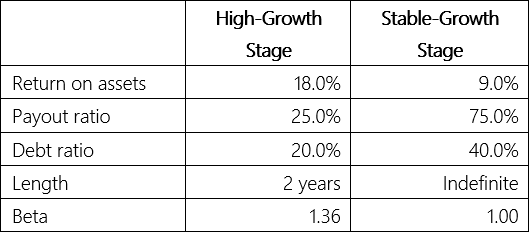
Walters expects the high-growth stage to phase into the stable-growth stage evenly over a two-year period, before reaching stable growth in Year 5. Dividends per share are currently CAD 6.40. The risk-free rate is 4.0% and the market risk premium is 5.0%.
REQUIRED:
- Estimate the intrinsic value of Samantha Company’s shares using the 3-stage income approach (DDM).
H. Income Approach (DDM) at ABC
Cathy Evert was assigned to value ABC Ltd. She collected the following information:
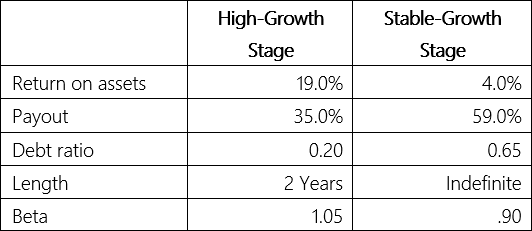
Evert expects the high-growth period to phase into the stable-growth period evenly over a 2-year period before reaching stable growth in Year 5. The 20-year government bond rate is 5.0% and the market risk premium is 4.5%. Dividends per share were CAD 3.52 at the end of last period.
REQUIRED:
- Estimate the intrinsic value of ABC’s shares using the 3-stage income approach (DDM).
I. Implied Growth Rate of Dividends
Nancy Wong is an equity analyst who is researching Calibre Company. Calibre is a manufacturer of ketchup and other condiments.
Calibre’s common share currently trades for CAD 45.00 and pays an annual dividend of CAD 1.35. Wong is having difficulty determining a historical growth rate for the company’s dividends and does not feel that the consensus industry 3-year estimates are accurate. Wong has decided to calculate Wong’s implied gd to determine if it is reasonable and to make her buy, sell, or hold recommendation accordingly.
Calibre has a beta of 1.2 and the market risk premium is estimated to be 5.5% and the 20-year treasury bond rate is 4.0%. Inflation is expected to average 2.0% in the future and the consensus forecast for the real long-term growth rate of the Canadian economy is 1.75%.
REQUIRED:
- Should Wong recommend Calibre as a buy, sell or hold?
J. Income Approach (FCFE) at Shelton
Shelton Industries had earnings per share of CAD 3.15 in 2013, and paid dividends per share of CAD 1.65. Its depreciation expense was CAD 305 million, capital expenditures were CAD 465 million, and working capital increased by CAD 25 million.
Shelton is a mature company whose earnings are expected to grow at a constant rate of 3.0% a year. It has a beta of 1.25 and the 20-year treasury-bond rate is 4.0% and the market risk premium is 5.0%. The debt ratio is expected to remain constant at 20.0%. There are 155 million common shares outstanding.
REQUIRED:
- Estimate the intrinsic value of Shelton’s shares using the 1-stage income approach (DDM).
- Estimate the intrinsic value of Shelton’s shares using the 1-stage income approach (FCFE).
- Why is the intrinsic value in Part 1 lower than Part 2?
K. Income Approach (FCFE) at Global
Global Ltd.’s CFO is valuing her company as the first step in an initial public offering. Sales were forecasted for the next three years based on a consensus estimate of industry analysts. The percentage of sales method was used to prepare detailed proforma financial statements. After three years, the company is expected to grow at the long-term growth rate of the economy.
Global Ltd.
Balance Sheet (in CAD thousands)
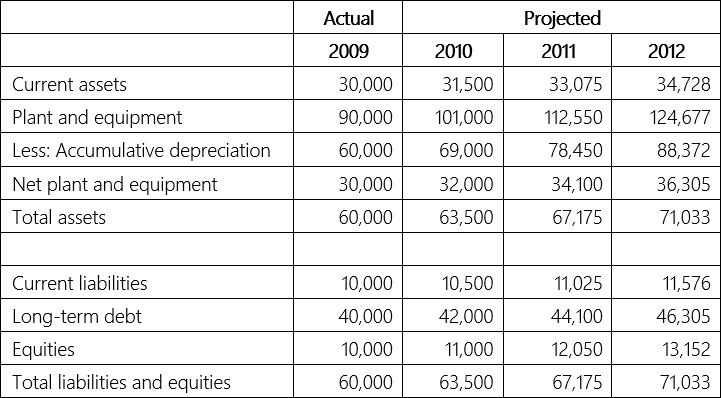
Global Ltd.
Income Statement (in CAD thousands)
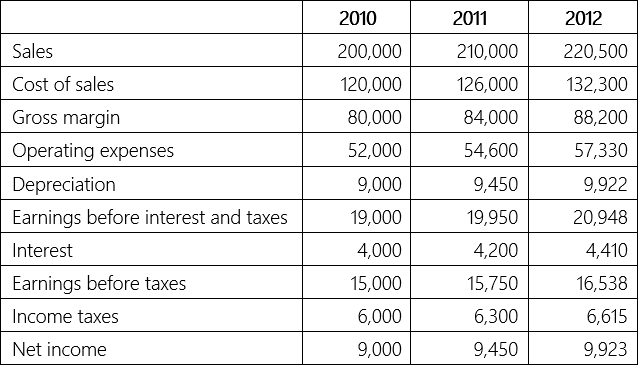
Other Information
Global has a beta of 1.3. The 20-year U.S. treasury bond rate is 4.0%, the market risk premium is 5.0% and the estimated long-term growth rate of the economy is 3.0%.
REQUIRED:
- Estimate the intrinsic value of Global using the 2-stage income approach (FCFE).
L. Income Approach (FCFE) at Ricco
Jackie Jolson, CFA, is the CEO of a private equity fund that is considering buying Ricco Ltd., a major supplier of electronic components to the aircraft industry in early 2015. Jolson has collected the following information:
Current Information
- Revenues per share 2014 – CAD 15.70 per share
- EPS 2014 – CAD 3.20 per share
- Capital expenditure – CAD 1.25 per share
- Depreciation per share 2014 – CAD .70 per share
High-Growth Period – 2 Years
- ROA – 20%
- Debt ratio – 30%
- Retention ratio – 90%
- Beta – 1.45
- Working capital – 15% of sales
Stable-Growth Period
- ROA – 4%
- Debt ratio – 50%
- Retention ratio – 40%
- Beta – 1.10
- Working capital – 15% of Sales
- Capital expenditures are offset by depreciation
The sustainable growth rate is used to estimate Ricco’s growth rate. The risk-free rate is 4.0% and the market risk premium is 5.0%.
REQUIRED:
- Estimate the intrinsic value of Ricco Ltd.’s shares using the 2-stage income approach (FCFE).
- What growth rate should Ricco’s sustainable growth rate in the stable-growth period not exceed?
M. Income Approach (FCFE) at Quazar
Heather Johnson, CFA, is an equity analyst with a leading mutual fund company. She is attempting to value Quazar Ltd. to determine if it is a suitable investment and collected the following information:
Current Information
- Revenues per share 2004 – CAD 21.23
- EPS 2004 – CAD 4.32
- Capital expenditures per share 2004 – CAD 3.56
- Depreciation per share 2004 – CAD 1.10
High-Growth Period – 3 Years
- ROA – 15%
- Debt ratio – 25%
- Retention ratio – 100%
- Beta – 1.35
- Working capital – 10% of sales
Stable-Growth Period
- ROA – 6%
- Debt ratio – 40%
- Retention ratio – 30%
- Beta – 1.10
- Working capital – 10% of sales
- Capital expenditures are offset by depreciation
The risk-free rate is 4.0% and the market risk premium is 5.0%.
REQUIRED:
- Estimate the intrinsic value of Pulsar’s shares using the 2-stage income approach (FCFE).
N. Income Approach (FCFF) at Pulsar
Heather Johnson is valuing Pulsar Ltd. to determine if it is a suitable take-over target for the investment fund she manages. She has projected key aspects of Pulsar’s performance for the next three years beginning in 2015 after which she expects the company will grow at the long-term growth rate of the economy. The following data was collected:
Pulsar Ltd.
Income Statement (in CAD thousands)
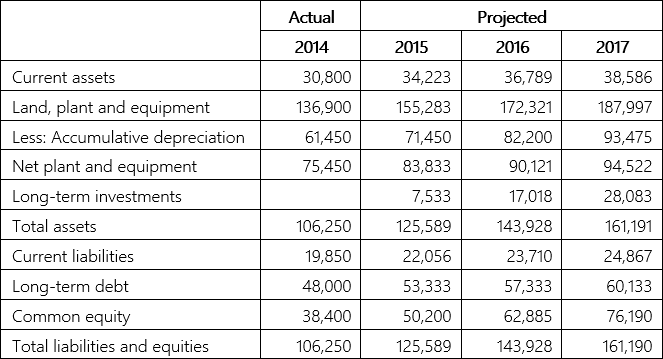
Pulsar Ltd.
Income Statement (in CAD thousands)
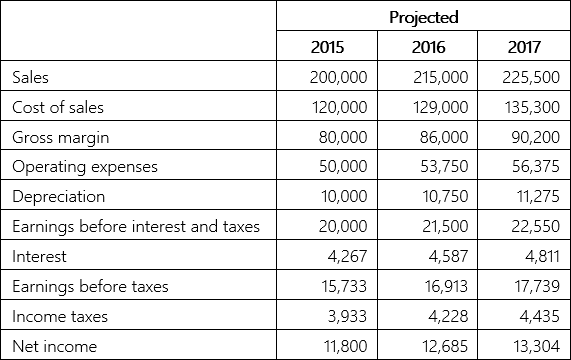
Currently, the market value of Pulsar’s debt is estimated to be CAD 54,250,000 – it has no preferred shares. Its long-term investments consist of idle land with a fair value of CAD 34,750,000 that is not being used in operations and does not generate any income. Pulsar’s weighted average cost of capital is 10.2% and its corporate tax rate is 25.0%. The estimated long-term growth rate of the economy is 3.0%.
REQUIRED:
- Estimate the value of Pulsar’s shares using the 2-stage income approach (FCFF).
- Why was the value of the long-term investment (idle land) included in the valuation?
- What is the advantage of using the FCFF approach instead of the FCFE approach?
O. Income Approach (FCFF) at Wellington
Joe Washington, CPA, CBV, is a partner at a public accounting firm specializing in business valuations who has been asked to value Wellington Ltd. as a potential divestiture.
Current Information
- EBIT in 2004 – CAD 532 million
- Capital expenditures – CAD 310 million
- Depreciation – CAD 207 million
- Revenues – CAD 7,230 million
- Working capital as a percentage of revenue – 25%
- Tax rate – 36%
High-Growth Period – 5 Years
- Growth rate in EBIT, revenue, capital expenditures, depreciation – 8%
- Beta – 1.25
- Cost of debt – 9.5% (before tax)
- Debt ratio – 50%
Stable-Growth Period
- Growth rate of EBIT, revenue, capital expenditures, depreciation – 5%
- Beta – 1.00
- Cost of debt – 8.5% (before tax)
- Debt ratio – 25%
- Capital expenditures offset by depreciation
Wellington’s assets include CAD 45 million in short-term investments and CAD 10 million in idle land that are not needed for its operations. It also has a CAD 20 million pension plan surplus.
Currently, the market value of the debt is estimated to be CAD 2,740.58 million. The estimated risk-free rate is 7.5% and the market risk premium is 5.5%.
REQUIRED:
- Estimate the intrinsic value of Wellington using the 2-stage (FCFF) approach.
P. Normalizing EBIT (1-t) and Net Income
Case 1 – Average Company Ratios
Allison Ltd. is a cyclical company whose ROA averaged 7.5% over the last business cycle. It currently has CAD 25 million in total assets and a debt ratio of 50%. Its debt has an average interest rate of 9% and its marginal tax rate is 25%. Allison feels it operations have not changed significantly in nature since the beginning of the last business cycle, but it has grown considerably and experienced inflation of 2%.
REQUIRED:
- Calculate Allison’s normalized EBIT (1-t) and net income.
Case 2 – Average Industry Ratios
Travers Inc. is a cyclical company. It currently has CAD 60 million in total assets and a debt ratio of 50%. Its debt has an average interest rate of 8% and its marginal tax rate is 25%. It has experienced some company-specific problems during the last business cycle that influenced its financial ratios. The industry average ROE averaged 8.5% while Travers’ ROE was 7.8%. Since the beginning of the last recession, the company has grown considerably and experienced inflation of 2%.
REQUIRED:
- Calculate Travers’ normalized EBIT (1-t) and net income.
Case 3 – Rating Firms
Harrison Co. has a bond rating of BBB. Companies with this rating had an average times interest earned ratio of 3.15 over the last business cycle. Harrison had CAD 85 million in interest expense last year and a marginal tax rate of 25%.
REQUIRED:
- Calculate Harrison’s normalized EBIT (1-t) and net income.
Q. Income Approach (FCFF) for a Distressed Firm
Duckworth Industries is a mature manufacturing company who experienced heavy losses over the last two years due to excessive borrowing, poor operational performance and a number of mishandled product launches. Early in 2017, Duckworth’s board of directors hired a new CEO who prepared a 3-year plan to restore the company’s financial health.
Angie Wilson is an analyst with Vulture Capital Inc., which invests in companies experiencing financial difficulties. After attending a presentation by Duckworth’s new CEO and reviewing the 3-year plan, she prepared the following data:
Current Information in 2016
- Sales – CAD 3,200 million
- Operating profit margin – 8.5%
- Capital expenditures – CAD 1,235 million
- Depreciation – CAD 1,078 million
- Working capital as a percentage of sales – 25%
- Beta – 1.75
- Cost of debt – 9.5% (before tax)
- Debt ratio – 50%
- Tax rate – 25%
Transition Period – 3 Years
- Year 1
- Growth rate in sales – 15%
- Operating profit margin – 9.0%
- Growth rate in capital expenditures and depreciation – 5%
- Working capital as a percentage of sales – 20%
- Beta – 1.61
- Cost of debt – 9.0% (before tax)
- Debt ratio – 45%
- Year 2
- Growth rate in sales – 10%
- Operating profit margin – 9.5%
- Growth rate in capital expenditures and depreciation – 5%
- Working capital as a percentage of sales – 19%
- Beta – 1.40
- Cost of debt – 7.5% (before tax)
- Debt ratio – 35%
- Year 3
- Growth rate in sales – 10%
- Operating profit margin – 10.5%
- Growth rate in capital expenditures and depreciation – 5%
- Working capital as a percentage of sales – 17%
- Beta – 1.32
- Cost of debt – 7% (before tax)
- Debt ratio – 30%
Stable-Growth Period
- Growth rate of sales – 5%
- Operating profit margin – 10.5%
- Capital expenditures offset by depreciation
- Working capital as a percentage of sales – 15%
- Beta – 1.25
- Cost of debt – 6% (before tax)
- Debt ratio – 25%
Currently, the market value of the debt is estimated to be CAD 4,096.39 million. The estimated risk-free rate is 4.0% and the market risk premium is 5.5%.
REQUIRED:
- Estimated the intrinsic value of Duckworth using the 2-stage income approach (FCFF).
R. Trailing and Leading P/E Ratios
Goldeye Ltd.’s share price is CAD 39.45 on January 10, 2013. The following quarterly EPS data in CAD is available:
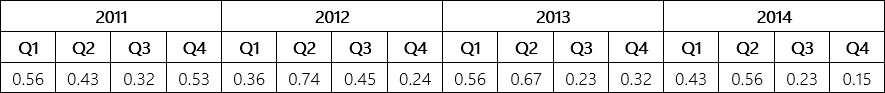
Goldeye’s accounting period is from July 1 to June 30. Earnings have not yet been reported for Q4, 2012.
REQUIRED:
- Calculate the 12-month trailing P/E ratio using two different industry methods:
- Last four quarters for which earnings have been reported
- Last complete fiscal period
- Calculate the 12-month leading P/E ratio using three different industry methods:
- Next 4 quarters including the current quarter
- Next 4 quarters not including the current quarter
- Next fiscal year
S. Normalizing EPS
Allison Ltd. is a cyclical company that experienced a major loss in 2016. The CFO decided to normalize EPS to better measure the company’s performance. The period 2010-2015 matches the last business cycle. The following information was collected:
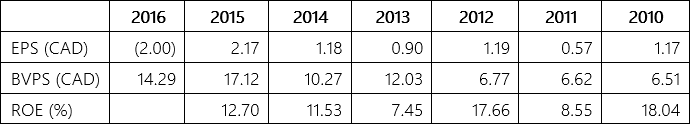
Allison Ltd.’s share closed at CAD 27.45 on January 2, 2017.
REQUIRED:
- Calculate the normalized trailing P/E for Allison based on the average historical EPS during the last business cycle.
- Re-do Part 1 based on the average historical ROE.
- Which method is more accurate?
T. Justified Benchmark Multiples (P/E, P/S, P/BV) at Irwin
Irwin Industries is valuing a potential acquisition. It collected the following information:
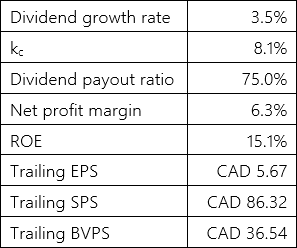
The acquisition target has 100,000 common shares outstanding.
REQUIRED:
- Estimate the intrinsic value of the acquisition using the justified trailing P/E, P/S, and P/BV multiples.
- How could the trailing EPS, SPS, and BVPS values be improved?
- Which multiple is likely preferred for valuing the acquisition? Explain.
U. Justified Benchmark Multiple (P/E) at Hector
Hector Ltd. is a manufacturer of condiments that grocery stores resell under their own private brands. EPS was CAD 3.98 and DPS was CAD 2.56 last year and their shares currently trade at CAD 55.45. EPS is forecasted to grow at a modest 3.5% in the long term and the company is expected to maintain a constant dividend payout ratio. The company’s beta is 1.1. The risk-free rate is 4.0% and the market risk premium is 5.0%. Shares are considered fairly valued if the current P/E ratio is between ±5.0% of the justified P/E multiple.
REQUIRED:
- Determine if Hector’s shares are undervalued, fairly valued, or overvalued based on its justified trailing P/E multiple.
- Discuss two major limitations of this approach.
V. Justified Benchmark Multiple (P/E) for an Industry
FinTech Investments initiated coverage of a new industry and collected the following historical information: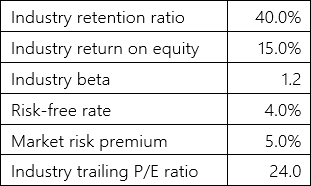
The industry is considered fairly valued if its P/E ratio is between ±5.0% of the justified P/E multiple.
REQUIRED:
- Determine whether the industry is currently overvalued, fairly valued or undervalued.
- Explain how the information in Part 1 could be used.
- How was the industry trailing P/E ratio calculated?
- How were the industry beta, retention ratio, and return on equity calculated?
- What is a major limitation of this approach?
W. Justified Benchmark Multiple (P/E) Using a 2-Stage Model at Dixon
Dixon Enterprises is valuing one of its subsidiaries which it plans to divest in the coming year. The following information was collected:
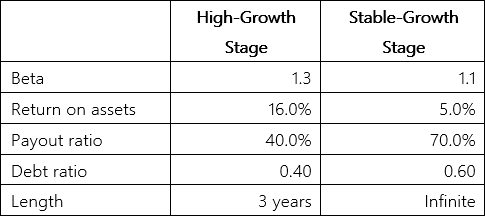
Normalized EPS is CAD 5.10. The risk-free rate is 4.0% and the market risk premium is 5.0%.
REQUIRED:
- Estimate the intrinsic value of Dixon using the 2-stage justified P/E multiple approach.
X. Market Multiples Approach (P/E) at Hi-tech
Alexa Jackson is attempting to value the shares of Hi-Tech Ltd. in early 2016 to determine if they are currently overvalued, fairly valued, or undervalued. Hi-tech’s share price is currently CAD 56.48. Jackson was able to collect the following data for a group of comparable companies from Hi-Tech’s sub-industry:
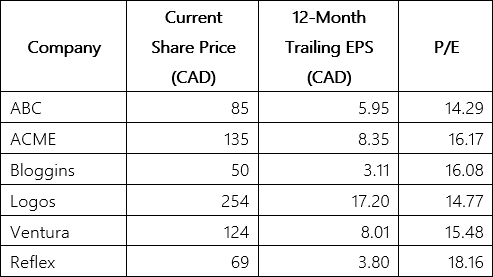
Hi-tech’s 12-month trailing EPS was CAD 4.51 in 2015 but Jackson expects its 12-month leading EPS to fall to CAD 3.51 in 2016 due to new product delays.
REQUIRED:
- Determine whether the shares of Hi-tech are overvalued, fairly valued, or undervalued.
- What could be done to improve the accuracy of the valuation?
Y. Market Multiples Approach (P/BV) at Ballantyne
Ballantyne Petroleum is a privately-held company that is trying to determine the fair value of its shares. These shares do not trade publicly, so data for the following comparable companies in Ballantyne’s sub-industry were collected:
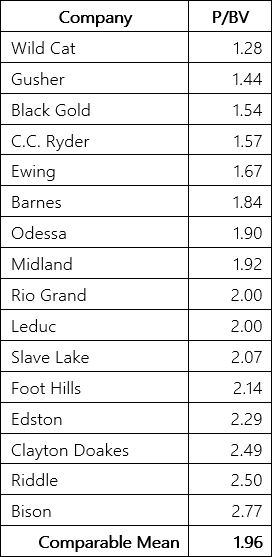
Ballantyne’s BVPS is CAD 25 based on 10,000,000 shares.
REQUIRED:
- Estimate the intrinsic value of Ballantyne’s shares using the market multiples P/BV approach.
- What actions could Ballantyne take to improve the accuracy of its estimate?
Z. Market Multiples Approach (P/E) at Regal
Kathleen Johnson is an equity analyst. She plans to use the average P/E ratio from a group of comparable companies from Regal’s sub-industry to determine whether the company is undervalued, fairly valued, or overvalued. The following data was collected:
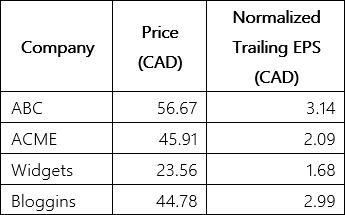
The following earnings data for Regal was available over the last business cycle:
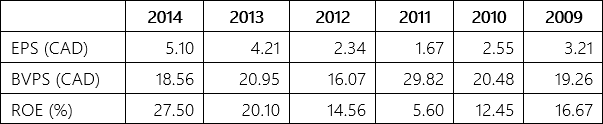
In early January, 2015, Regal’s share price was CAD 35.56 per share.
REQUIRED:
- Determine whether the shares of Hi-tech are overvalued, fairly valued, or undervalued.
- Why was normalized EPS used?
- Indicate two limitations of the analysis based on sub-industry data.
AA. Market Multiples Approach (P/E) at Horizon
Alexa Jackson is a junior equity analyst with Horizon Investments. Senior management has asked her to recommend a share from a number of new technology companies in the same sub-industry for inclusion in the firm’s value fund. Jackson collected the following data:
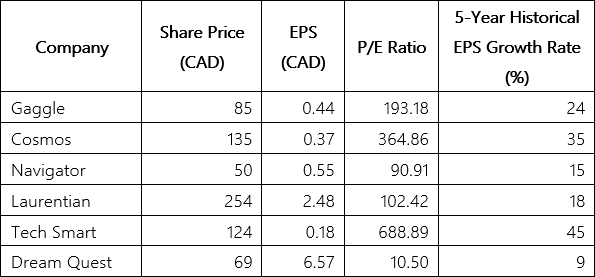
These start-up companies have minimal earnings but are trading at very high P/E multiples compared to other companies. Jackson was confused by these results.
REQUIRED:
- What stock should Jackson recommend to senior management? Explain.
BB. Market Multiples Approach (P/E) at Maple Leaf
Halley Jones is an equity analyst at Maple Leaf Investments and has been asked to research a new sub-industry for the firm. The following information was collected for a group of comparable companies:
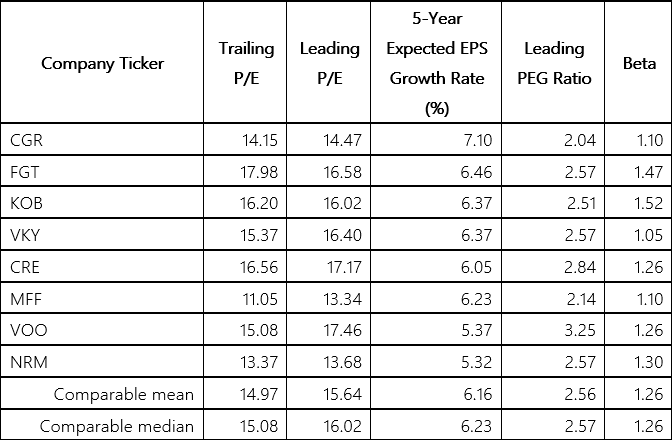
REQUIRED:
- What share(s) should Jones recommend as the best value investment based on trailing and leading P/E only?
- Why may the median value be used instead of the mean?
- What are the problems with this approach?
- Re-do Part 1 using all information provided?
CC. Market Multiples Approach (P/S) at RRJ
Bob Marley, CFA is an equity analyst with RRJ Investments and is responsible for covering a specific sub-industry. He collected the following information about three comparable companies:
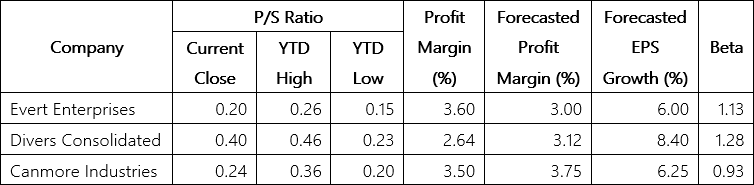
REQUIRED:
- What company should Marley recommend as the best value investment? Explain.
DD. Market Multiples Approach (P/BV) at Surefire
Robert Wilson is an equity analyst with Surefire Investments and is trying to recommend a company in a specific sub-industry. Wilson found four companies with low P/BV ratios compared to the industry. The following data was collected:
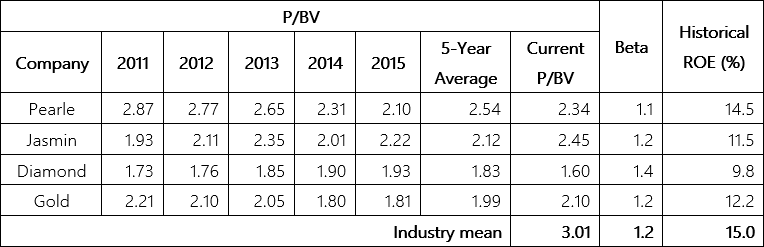
REQUIRED:
- Which share should Wilson recommend?
- Why was the industry mean used instead of a comparable company mean?
- What improvements could be made to Wilson’s methods for evaluating investments?
EE. Market Multiples Approach (P/E) at Astro
Dexter Manley is an equity analyst with Astro Financial. He is considering three companies for inclusion in its value fund. To determine the investment potential of each company, Manley decides to compare their P/E ratio to the P/E of the market. Based on his analysis, Manley makes recommendations to the fund’s investment committee.
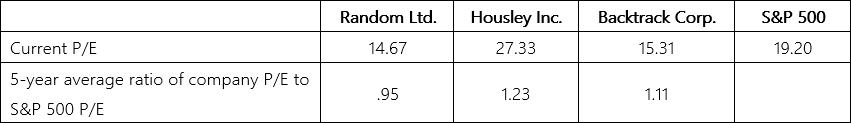
REQUIRED:
- Which company(s) is undervalued and should be recommended for inclusion in the value fund?
- What is the advantage of using the market P/E as a benchmark?
FF. Market Multiples Approach (P/E) using Multi-Regression at Timmins
Ranson Witherspoon is an equity analyst with a large pension fund and is researching a Timmins Industries to determine whether the fund should invest. It has a dividend payout ratio of 0.50, a beta of 1.1, and an earnings growth rate of 7.0%. Witherspoon developed a multi-regression model with a high R2 based on eight comparable companies in the appropriate sub-industry.
- P/E multiple = 13.05 + 2.34 (Dividend payout ratio) – 0.31 (Beta) + 15.23 (Earning growth rate)
- R2 = .89
- Dividend payout ratio – Historical dividend payout ratio
- Beta – Stock’s current beta
- Earnings growth rate – Historical earnings growth rate
The company currently has a trailing P/E ratio of 17.5.
REQUIRED:
- Make a recommendation to the manager of the pension fund concerning this investment.
- What is the main advantage of the multi-regression approach?
- Describe potential statistical problems associated with the multi-regression approach.
GG. Market Multiples Approach (P/E) using Multi-Regression at Shamrock
Cynthia McLeod is an equity analyst with Shamrock Investments and has been asked to prepare a list of undervalued shares in a sub-industry the firm is covering. She collected the following data:
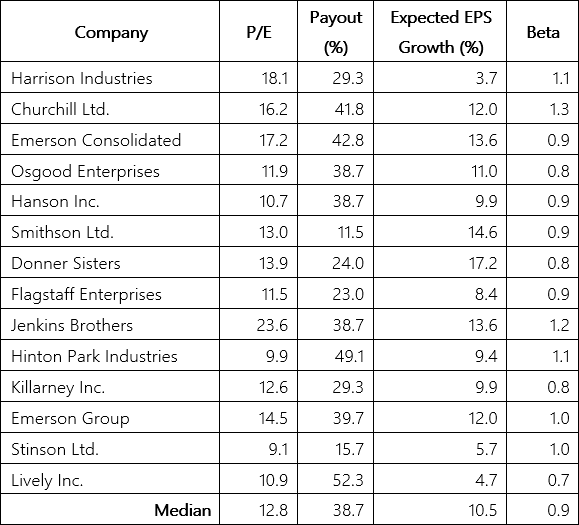
REQUIRED:
- Based on the median sub-industry P/E ratio, provide a list of undervalued companies.
- Describe a weakness of the approach in Part 1.
- Develop a multi-regression model to predict the sub-industry P/E ratio.
- Describe any statistical concerns with the multi-regression model.
- Provide a revised list of undervalued companies based on the model in Part 3.
HH. Market Multiples Approach (P/E) using Multi-Regression at Wainwright
Krysta Emerson, CPA has been asked by a client to value Wainwright Electronics. The company has been in operation for eight years and has been very successful, but the owner needs to sell due to illness. Emerson’s accounting firm has developed a multi-regression model for the electronics component sub-industry which she has been instructed to use in valuing the firm.
- P/E = 17.45 + .0654 (Expected earnings growth rate) -.612 (Beta) + .512 (Dividend payout)
The R2 is 0.76 and all coefficients are statistically significant and all the coefficient signs are correct.
The expected earnings growth rate has been 15.0% over the last five years which is expected to continue over the next five years. The average beta for companies in the electronics component sub-industry is 1.21. These companies have an average debt ratio of 30.0% but the client has no debt. The client also does not pay a dividend but has net income of CAD 15 million last year. Capital expenditures were CAD 18 million, depreciation was CAD 7 million and net working capital increased by CAD 1 million. The tax rate is 25.0%.
REQUIRED:
- Estimate the intrinsic value of the client’s company using the market multiples P/E approach using multi-regression.
II. Historical Average Multiples Approach (P/E) at Lancaster
On January 20, 2016, an equity analyst was studying Lancaster Enterprises. Its share price is currently CAD 52.44 and its 2015 12-month trailing EPS was CAD 4.10. The analyst collected a historical record of its 12-month trailing P/E ratios for the previous business cycle.
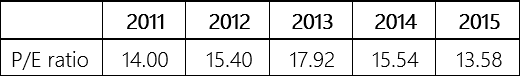
The consensus analyst estimate is that Lancaster’s 12-month leading EPS will be CAD 4.35 in 2016.
REQUIRED:
- Are the shares of Lancaster overvalued, fairly valued or undervalued?
- Why was this valuation approach used?
JJ. Market Multiples Approach (EV/FCFF) at Sunshine
Jan Wesley is an equity analyst with Sunshine Investments. She is analyzing three companies in the footwear sub-industry to determine if any are possible candidates for Sunshine’s value fund. The following information was collected (in CAD thousands):
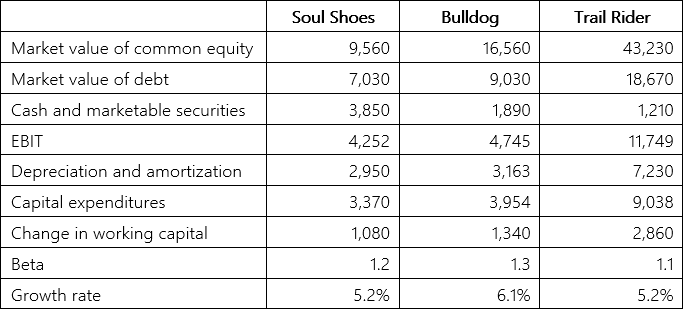
The tax rate is 25.0%.
REQUIRED:
- Which company should Wesley recommend?
- Why might Wesley have chosen the EV/FCFF multiple to analyze these three companies?
KK. Market Multiples Approach (EV/FCFF) at Ashton
Ashton Ltd. is a privately-held company in the forest products sub-industry. The owner is interested in selling 40% of the company to diversity her holdings and needs to determine an appropriate selling price for the IPO.
An analysis of other publicly-held forestry companies currently indicates an average EV/FCFF ratio of 12.3. Ashton also collected the following information (in CAD millions) relating to the last year:
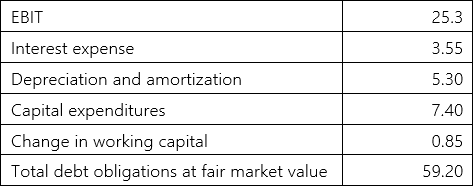
Ashton’s tax rate is 25.0%.
REQUIRED:
- Estimate Ashton’s intrinsic value.
- How might this estimate be improved?
LL. Asset-Based Approach at Willington
Willington Ltd. had the following balance sheet (in CAD thousands) on December 31, 2015:
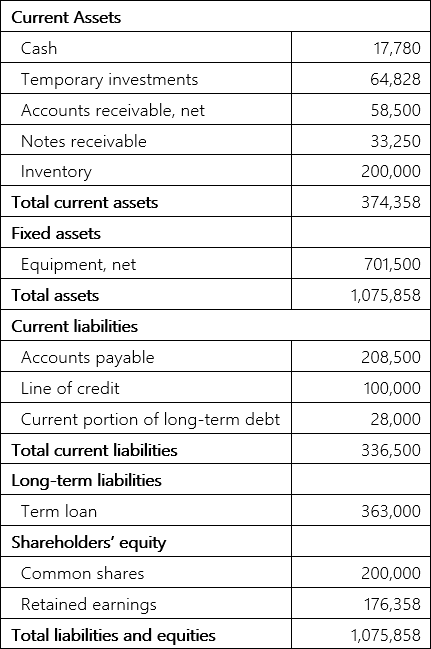
Other Information
- Temporary investments consists of a deposit that was sold at a discount. It matures in two months and has a coupon rate of 2.5%, compounded monthly. The current market rate is 2.75%, compounded monthly.
- Accounts receivable are due in 90 days, but the net realizable value is estimated to be only CAD 48,000 due to an increase in bad debts. The current market rate is 3.25%, compounded monthly.
- Notes receivable are with the government so they are not subject to bad debts. The coupon rate is 3.25%, compounded monthly which approximates the market rate.
- It is estimated that the inventory can be sold for CAD 350,000 in the next few months, but additional costs equal to approximately 10.0% of the selling price would have to be incurred for storage, shipping, and installation.
- It is estimated that equipment in similar condition could be purchased for CAD 950,000.
- No building asset is recorded as it is fully depreciated, but it is estimated to have a market value of CAD 210,000.
- The land is being lease from a First Nations band for CAD 10,000 a year. Fifty years remains on the lease and payments are made at the end of the year. The current market rate on a mortgage loan of similar risk is 7.5%, compounded yearly.
- Willington has a government license with a current market value of CAD 58,000.
- The accounts payable are due in 60 days and the current market rate is 3.25%, compounded monthly.
- Line-of-credit financing is currently at 4.5% which approximates the market rate.
- A product liability lawsuit is likely to be settled for CAD 50,000 in the next few weeks.
- The term loan is being paid in equal monthly payments over the next 10 years at payments of CAD 4,540 per month. The market rate is 6.5%, compounded monthly.
- FCFF is CAD 162,944. WACC is currently 9.5% and the estimated growth rate is 3.0%. It is estimated that excess profits will be earned indefinitely.
REQUIRED:
- Estimate the intrinsic value of Willington using the asset-based approach.
MM. Asset-Based Approach at Ambrose
Ambrose Ltd.’s had the following balance sheet (in CAD thousands) on December 31, 2015:
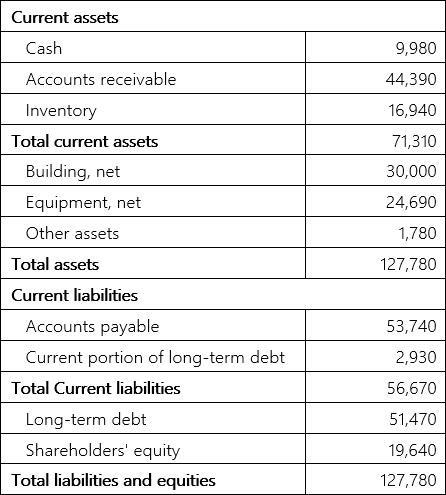
Other Information
- Accounts receivable are due in 120 days, but the net realizable value after allowing for bad debts is CAD 35,000,000. The current market rate is 3.25%, compounded monthly.
- The inventory can currently be sold for CAD 19,500,000, but additional storage and handling costs equal to 5.00% of the selling price will have to be incurred.
- The building is estimated to have a market value of CAD 65,000,000 based on recently appraised values in the area, while similar equipment in an equal state of repair could be purchased for CAD 32,500,000.
- Land is being leased for CAD 2,300,000 a year – 25 years remain on the lease and the payments are at the end of the year. The current market rate on a mortgage loan of similar risk is 7.0%, compounded monthly.
- The other assets consist of deferred research and development costs which have an estimated market value of CAD 57,500,000.
- The accounts payable are due in 60 days and the current market rate is 3.35%, compounded monthly.
- The long-term debt in being paid in monthly instalments over the next five years at an interest rate of 6.5%, compounded monthly which approximates the market rate.
- FCFF is CAD 25,000,000. WACC is currently 10.5% and the estimated growth rate is 3.0%. It is estimated that excess profits will be earned for five years.
REQUIRED:
- Estimate the intrinsic value of Ambrose using the asset-based approach.
NN. Residual Income Approach at High Mountain
High Mountain Industries (HMI) is considering acquiring another company. It currently trades at CAD 53.42 and has a book value of CAD 47.98. The firm’s long-term return on equity and a long-term growth rate are estimated to be 10.2% and 3.5% and it has a required rate of return is 8.2%.
REQUIRED:
- Estimate the intrinsic value of the company’s shares using the 1-stage residual income approach. Is it a good investment?
- Describe a major limitation of this approach and how it should be addressed.
OO. Residual Income Approach at Majestic
Mary Rankin owns Majestic Group and hired Elizabeth Gowan, CFA to value the firm. Gowan made the following estimates:
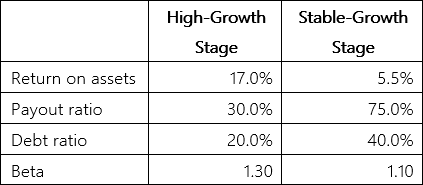
Gowan expects the high-growth stage to last for five years and then phase into the stable-growth stage evenly over a five-year period, before reaching stable growth in the eleven year when the rate of return on equity and required rate of return are equal. Majestic’s book value per share is currently CAD 8.45. The risk-free rate is 4.0% and the market risk premium is 5.0%.
REQUIRED:
- Estimate the intrinsic value of Majestic Group’s shares using the 3-stage residual income approach.
PP. Marketability Discounts at Adirondack
Adirondack Ltd. is a manufacturer of patio furniture made from recycled plastic containers. The privately-held company was founded 10 years ago by Kayley Phillips, P. Eng., who owns 60% of Adirondack with the remainder owned by a number of individual investors. Phillips has been considering taking Adirondack public for a number of years, but has hesitated to do so. The minority investors are very concerned about their lack of rights under the current shareholder agreement and have hired a financial analyst to determine the value of the company under the two forms of ownership.
Although Adirondack has been successful in terms of sales, the analyst feels it would be worth considerably more as a public corporation. Phillips is receiving an above market salary and the company also employs a number of her family members who contribute little to business operations. The company also pays for a lake resort that is used for entertaining clients, but that the Phillips’ family also uses on weekends and for holidays. Adirondack’s financial leverage is sub-optimal and its inventory levels are excessive.
By addressing these concerns, the analyst thinks the investment value of Adirondack will rise from CAD 85,000,000 to CAD 105,000,000. Based on his research, the analyst feels minority investors experience a marketability discount of 40% which should fall to 5% if Phillips commits to going public.
REQUIRED:
- Estimate Adirondack’s intrinsic value if Phillips decides to remain a private company from the perspective of the minority investors. Explain.
- Estimate Adirondack’s intrinsic value if Phillips commits to becoming a public company from the perspective of the minority investors. Explain.
- What actions could minority investors take to reduce the size of the marketability discount?
QQ. Valuing a Private Company at Adams River
Adams River Inc. is a privately-held, manufacturer of fishing boats which sells to outdoor goods retailers across Canada and the U.S. A minority investor in the company has hired Janice Hallson, CBV to estimate the value of the company.
Adams River had revenues of CAD 210.0 million and net income of CAD 11.8 million in the last year. Capital expenditures are equal to 25% of incremental revenues and depreciation is 90% of capital expenditures. Additional investments in working capital are equal to 20% of incremental revenue. The company’s debt ratio is 25% which is considered optimal. The company has been growing constantly at 3.4% per year over the last 10 years and has a tax rate of 25%.
After carefully reviewing Adams Rivers operations, Hallson felt that net income should be normalized by making the following adjustments:
- Founder and CEO’s salary is CAD 1,800,000, but it averages CAD 800,000 as similar firms.
- Personal expenses of CAD 300,000 where charged to the company.
Hallson decided to use the build-up method to determine its cost of equity instead of CAPM. Calculating a beta without reliable public information was thought to be too uncertain. The risk-free rate is 4.0% and the market risk premium is 5.0%. An information services company provided a size premium of 3.0% and an industry premium of 1.0%. Hallson decided to add another 1.0% to the cost equity to allow for above sub-industry average operating and financial leverage.
Due to Adams River’s strong shareholders agreement from the perspective of the minority investors, Hallson applied a marketability discount of only 20%.
REQUIRED:
- Estimate the intrinsic value of Adams River from the perspective of the minority interest.
- Estimate the intrinsic value of Adams River as a public company from the perspective of the minority interest.
RR. Valuing a Private Company at Dawson Falls
Dawson Falls Inc. is a privately-held company that manufactures canned vegetables. Archie Davies is exploring the acquisition of 100% of the company or a minority interest if the owner is not willing to sell. Davies does not want to take the company public.
Dawson had sales of CAD 190 million in the last year. The gross profit margin averages 45% of sales and selling and administration averages 20%. Depreciation is 5% of sales and capital expenditures equal to 110% of depreciation are needed to support current operations. Additional capital expenditures equal to 12% of incremental revenue are needed to support new growth. Working capital is 10% of incremental revenue. Dawson Falls’ annual growth rate is 3.5% and it has a tax rate of 25%.
Recent guideline private transactions have an average P/FCFF multiple of 10.32. Dawson Falls’ debt has a market value of CAD 105.30. A marketability discount of 25% and a non-control discount of 20% apply when valuing minority interests.
REQUIRED:
- Estimate the intrinsic value of Davies’ proposed 100% interest in Dawson Falls.
- Estimate the intrinsic value of Davies’ potential minority interest in Dawson Falls.
- Identify potential problems using recent guideline private transactions to calculate the market multiple.
