Module 3: Financial Planning and Growth
Companies engage in both short-term and long-term financial planning. Most students first study short-term financial planning in introductory management accounting where they learn to prepare an organization’s master budget. The master budget is a comprehensive short-term financial plan that is divided into both operating and financial budgets as shown in Exhibit 1.
Exhibit 1: Master Budget

Operating budgets deal with the income-generating activities of a business and culminate in the production of a budget or pro forma income statement for the upcoming year. Financial budgets consist of the long-term sales forecast, capital budget, cash budget, budgeted balance sheet and budgeted statement of cash flows. The cash budget focuses on the cash inflows and outflows of a business including any needed capital purchases and financing while the budgeted balance gives an idea of the company’s financial position at the end of each period. The long-term sales forecast estimates future demand to determine what capital projects are needed and whether they will have a positive net present value. The budgeted statement of cash flows just restates the information in the cash budget in the format required for the company’s annual report.
Operating budgets with their focus on product costing and variance analysis are primarily of interest to accountants. For finance professionals, the financial budgets are the most important as they help determine whether a company has sufficient cash and is complying with it lending conditions, adhering to its financial policies, and achieving its financial goals.
Companies also develop long-term financial plans for periods of greater than a year based on the long-term sales forecast. These plans are less accurate and detailed than short-term financial plans but still provide important information relating to a company’s future growth, the assets required to support this growth, and the necessary financing.
This module focuses on the financial budgets as well as long-term financial planning including managing a company’s sustainable growth rate. Capital Budgeting is covered in a separate module. A course in introductory management accounting has likely already covered operating budgets in detail.
3.1 | Rationale for Financial Planning
Before looking at the short-term and long-term financing planning process, managers must understand why financial planning is so important to a company. It helps it:
- Plan for growth and change.
- Growth is a goal of most companies, but it must be accomplished wisely. Growth should be profitable (i.e. undertake positive net present value projects only) and done at a speed that does not lead to problems like cash shortfalls, excessive borrowing or employee shortages. In a global economy rapid changes in technology and consumer tastes are the norm, so companies must adapt or they will perish.
- Deal with complexity and uncertainty.
- Most companies need a process to simplify their complex operations so they can be managed effectively. Changes in financial performance under different business and economic scenarios need to be explored so companies can be better prepared for all contingencies. The feasibility of potential new business ventures must also be determined.
- Determine reasonable financial goals.
- Some financial goals such as high profitability may not be feasible due to the nature of a business or industry competition. Others such as maintaining high growth, while keeping financial leverage low and high dividend payouts high are difficult to achieve concurrently. Companies have to prioritize conflicting goals.
- Implement financial policies.
- A company adopts specific dividend, maturity matching or financial leverage policies to attract investment capital and manage risk. These policies greatly influence a company’s cash flows and the sources of temporary and permanent financing used.
- Remain focused and in control.
- Once a company establishes financial goals and policies, its employees must become fixated on achieving them and deal quickly with significant variances from planned performance. As economic conditions, competitive pressures, or consumer buying habits change, budgets are updated. If financial goals are reasonable and employees participate in setting them, they will provide valuable direction to a company’s workforce.
- Plan and monitor cash flows.
- The long-term goal of any company is to maximize its share price, but in the short-term its main concern is just to survive. This means generating sufficient cash to pay its liabilities as they come due in order to avoid bankruptcy.
- Plan investments and financing.
- With growth comes a need for additional net working capital and long-term assets. It also requires other inputs such as skilled labour or raw materials that may be in short supply. Growth is only possible if a company can raise the additional equity and debt financing needed to finance these asset purchases.
- Meet loan covenants.
- Commercial loans have positive, negative, and financial covenants or conditions that must be complied with so borrowers do not have their loans called. Maintaining a prescribe current ratio or ensuring that there is sufficient collateral does not just happen, it must be planned for.
- Communicate with lenders and investors.
- Lenders monitor commercial loans very carefully for any problems. Not only do they review past financial statements, they require pro forma financial statements too. Borrowers must prove to lenders that their loans have a high probability of being repaid in a timely manner and that the conditions will be met on an on-going basis. Pro forma financial statements are also provided to potential investors in business start-ups such as angels or venture capitalists so they can better understand the risks and potential returns before investing. Equity analysts who follow larger public companies rely on pro forma information as a basis for making their own projections about the company and deciding whether to issue buy, sell or hold recommendations to their clients.
3.2 | Short-term Financial Planning
What is Short-term Financial Planning?
Short-term financing planning involves estimating an organization’s budgeted or pro forma financial statements for the coming year. These pro formas are normally prepared on a monthly or quarterly basis to provide managers with timely data so they can quickly identify variances between budgeted and actual amounts and take corrective action. They can also be prepared on a “rolling” or continuous basis where as one period is completed another future period is added so a 12-month budget is always available.
Pro forma financial statements consist of the budgeted income statement, cash budget, and budgeted balance sheet. The cash budget has a different format than the cash flow statement students learn to prepare in introductory financial accounting. It is not divided into operations, investment and financing sections but instead into beginning cash, cash receipts, cash disbursements including capital expenditures, financing, and ending cash. This different format provides better information for financial planners, but both approaches are the same in that they explain why cash increased or decreased over the accounting period.
An electronic spreadsheet is used to prepare a short-term financial plan due its complexity. Most values in the budget income statement, cash budget, and budgeted balance sheet are calculated automatically using variables found on an input page. By putting all the budgeting variables in a central location, financial planners are able to change variables once instead of in a number of places throughout the worksheet.
Centralizing variables also allows financial planners to do “what if” analysis for the coming year using scenario analysis, sensitivity analysis, or simulation. With scenario analysis, planners define most-likely, best-case and worst-case scenarios by varying a number of key budgeting variables at once such as sales price, sales quantity and mix, and inputs costs including labour rates, material prices or interest rates. If budgeting outcomes are particularly sensitive to changes in only one variable then sensitivity analysis can be used where the one variable is changed while the all other variables are kept constant. Simulation can also be used where all budget inputs are varied at once over a defined range and frequency resulting in a probability distribution of the expected outcomes. By determining the effect these extreme outcomes have on operational and financial performance, companies can make sure they are well prepared to meet all challenges.
In addition to an input page and separate pages for the budgeted income statement, cash budget, and budget balance sheet, there is also a page for key financial ratios. These ratios are calculated once a draft budget is prepared to help determine whether the company:
- will have sufficient cash to meet its obligations.
- can obtain needed financing for projected growth in its working capital and long-term assets.
- complies with its lending conditions.
- adheres to its financial policies relating to dividend payment, maturity matching or financial leverage.
- can achieve its financial goals and objectives relating to profitability.
If a draft budget does not meet these requirements, then changes to growth projections and other key variables are made until a suitable plan is developed. These changes can all be conveniently made on the input page.
Financial planning spreadsheets take considerable time to be develop initially, but once they are perfected, they can be used in subsequent planning periods with minor modifications. For small business, Microsoft Excel is normally used, but larger organizations may purchase specialized accounting application software that can be customized to suite their budgeting needs.
How You Will Learn Short-term Financial Planning?
Short-term financial planning is a complex process that is best learned by working through an example with an explanation of every step. The first learning problem for this module provides such an example. A detailed answer key is included along with an Excel spreadsheet that shows how to automate the entire process. Also, a series of video discussions describe each step in developing the spreadsheet including what actions might be taken if the draft plan does not meet the organization’s financial requirements. Students are encouraged to work through the videos discussions first making sure they understand each step before moving on. After that, review the answer key and then study the spreadsheet carefully to learn how to automate the process. Additional learning problems are provided so students can try to prepare a short-term financing plan on their own.
3.3 | Long-term Financial Planning
What is Long-term Financing Planning?
Companies also develop long-term financial plans for periods of greater than a year, usually two to five years. These plans are normally done on a yearly basis and are less accurate and detailed than short-term financial plans due to greater uncertainty relating to key budget variables such as selling prices, sales quantity and mix, input costs, and interest rates. Despite this, they provide important information relating to a company’s long-term sales forecast, the fixed assets that will be needed to support future growth, and whether there will be enough cash to fund this growth given the company’s current capital structure. If cash is insufficient, the company will have to make some hard decisions. Using a greater proportion of debt to finance the company may be dangerous if borrowing is already at its optimal level and issuing new equity is expensive and can lead to control problems for existing owners. If raising additional external funding is not possible, a company may have no choice but to slow its rate of growth. This is why maximizing a company’s sustainable growth rate, the rate it can grow at without increasing its capital structure or issuing new common equity, is so important. Sustainable growth in studied in the next topic.
How does the Percentage of Sales Method Work?
The percentage of sales method is commonly used to prepare long-term financial plans. This method assumes that as a company’s sales grow, its operating expenses, working capital items (current assets and liabilities) and long-term assets (land, plant and equipment) will remain at approximately the same percentage of sales. For the remaining accounts, long-term liabilities and equity, their total value will be equal to assets minus current liabilities. The proportion of this amount that is either long-term debt or equity is dependent on the company’s target capital structure.
For operating expenses this assumption is reasonable. With working capital and long-term assets, it assumes that a company has a constant capital intensity ratio. Capital intensity ratio equals total assets divided by sales and measures the amount of assets required to generate CAD 1 in sales. If this ratio remains constant then the growth rate of assets and sales are the same. This ratio remains constant as long as the capital or labour intensity of the company’s production methods do not change.
Using the percentage of sales method, a long-term financial plan can be quickly prepared based on a sales forecast. There is some imprecision with particular balance sheet values due to economies of scale and excess production capacity. Long-term financial planning is an inexact process though and this level of uncertainty is generally felt to be acceptable. Each planner must determine the precision required and the amount of time they want to devote to the process.
An important output of the long-term financial plan is the amount of long-term debt and equity financing required to support planned growth. A major concern of companies is whether they will be able to secure this capital in the future. Securing additional debt is usually not a problem as long as the assets purchased are acceptable as collateral, the company is not exceeding its optimal capital structure, and economic conditions are good. Securing equity can be a problem. If the company is growing at a modest rate, retained earnings will be sufficient to fund growth while still paying a growing dividend to shareholders. If growth is more rapid, retained earnings may be insufficient. As discussed, reducing the dividend is not recommended and issuing new shares may not be an option due to factors such as high issuance costs or control issues. Hard decisions about cutting dividends, issuing new shares, or slowing growth will have to be made.
Modifying Balance Sheet Ratios
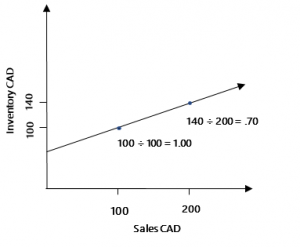
As discussed, there is some imprecision with the percentage of sales method due to economies of scale and excess production capacity. Financial planners can be more accurate by adjusting particular balance sheet amounts, usually inventory and fixed assets, for these effects.
- Economies of scale. Some assets remain at the same percentage of sales as a company grows (Exhibit 2) while others decline (Exhibit 3). This is common with inventory where a base stock is initially required to fill a company’s factories, distribution centres, or retail facilities but then proportionately less stock is needed to support subsequent sales increases. The line may even be curvilinear meaning minimal additional inventory will be required at high-volume levels.
-
Exhibit 2: No Base Stock Exhibit 3: Base Stock 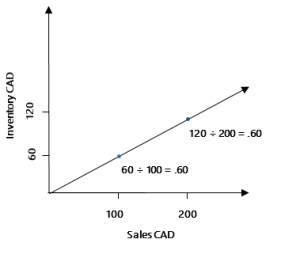
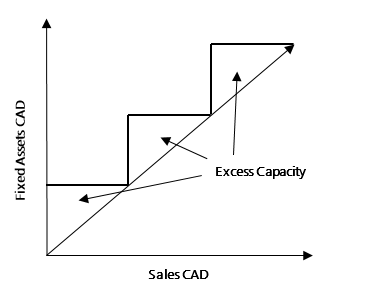
- Idle production capacity. Companies may have idle production capacity due to a recent recession or because capacity can usually only be added in large increments due to the “lumpy” nature of many assets. As a result, fixed assets may not grow despite an increase in sales until a company’s capacity is fully utilized, and then grow substantially when new capacity is added.
- Exhibit 4: Excess Capacity
Business Forecasting
Critical to any financial plan is an accurate sales forecast. Businesses employ both qualitative and quantitative techniques to estimate customer demand using past and current data. Qualitative methods are the most effective in the short-term and use the subjective opinions and judgements of customers and experts. Simple approaches such as executive opinions, salesforce polling, and customer surveys or focus groups are employed. More complex methods include formal market research using primary and secondary data; Delphi method using multiple panels of experts; or historical life-cycle analogy that bases forecasts on the historical demand for similar products. Quantitative methods include different statistical methods such as time series including trend projections, moving averages, exponential smoothing, and seasonal indexes; simple and multi-regression models; leading and lagging indicators; and econometric modeling.
Module: Business Forecasting will demonstrate how these different forecasting methods are applied.
3.4 | Sustainable Growth
What is the Sustainable Growth Rate?
Sustainable growth rate (SGR) is the growth rate of sales that a company can support assuming it does not issue new common equity and only uses its retained earnings to fund growth while maintaining constant financial fundamentals including its retention ratio (R), rate of return on equity (ROE), and capital structure (debt/equity). The SGR formula is:
[latex]{\text{SGR}} = \frac{{({\text{ROE}})({\text{R}})}}{{1 - ({\text{ROE}})({\text{R}})}}[/latex]
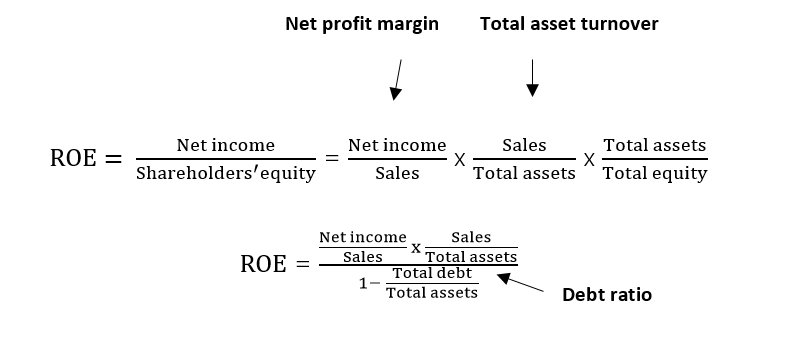
R is the portion of net income that is not paid out to shareholders and remains in the company to finance growth. ROE is a measure of profitability that relates net income to the shareholders’ equity. According to a 3-way analysis of ROE, three factors (net profit margin, total asset turnover, and debt ratio) cause this ratio to change:
In practice, companies do avoid issuing new common equity, try to maximize their ROE, and have established financial policies that result in stable retention and debt ratios. As a result, the SGR is commonly used to measure growth, although it should be used with caution if any of the financial fundamentals are changing.
Sustainable Growth Rate Formula
The SGR formula is based on the following general formula and assumptions:
- General Formula
- External common equity financing needed = Increase in total assets – Addition to retained earning – New borrowing
- Assumptions
- No new external common equity financing is used.
- Capital intensity ratio remains constant resulting in the same growth rate for both sales and total assets.
- Financial fundamentals remain constant.
Sustainable Growth Rate Formula with Variables
The general formula can be restated as:
- 0 = (Assets) (Growth rate in sales) – (Net profit margin) (Sales) (Retention Ratio) (1 + Growth rate in sales) – (Net profit margin) (Sales) (Retention ratio) (1 + Growth rate in sales) (Debt/Equity)
- Component 1: External common equity financing needed in the coming year equals zero if the company does not issue new external common equity.
- Component 2: Increase in total assets is the amount of new assets a company needs in the coming year to support growth. It equals current total assets times the growth rate in sales as the capital intensity ratio remains constant.
- Component 3: Addition to retained earnings is the portion of net income in the coming year that will be retained by the company. It equals current profits times the retention ratio times the growth rate in sales.
- Component 4: New borrowing is the amount of debt a company can raise in the coming year given the addition to retained earnings and the requirement that it keep its debt-to-equity ratio at a constant level. It equals Component 3 times the debt-to-equity ratio.
Manipulation of the Restated General Formula
- Step 1: Simplify the formula
-
- [latex]\begin{array}{rCl}0&=&({\text{A}})({\text{g}}) - ({\text{P}})({\text{S}})({\text{R}})(1 + {\text{g}}) - ({\text{P}})({\text{S}})({\text{R}})(1 + {\text{g}})(\frac{{{\text{D}}}}{{{\text{E}}}})\\0&=&({\text{A}})({\text{g}}) - ({\text{P}})({\text{S}})({\text{R}})(1 + {\text{g}})(1 + \frac{{{\text{D}}}}{{{\text{E}}}})\end{array}[/latex]
-
- A – Total assets
- g – Growth rate in sales
- P – Net profit margin
- S – Sales
- R – Retention ratio
- D – Debt
- E – Equity
- Step 2: Divide both sides by A and substitute in ROA
- [latex]\begin{array}{rCl}0&=&({\text{A}})({\text{g}}) - ({\text{P}})({\text{S}})({\text{R}})(1 + {\text{g}})(1 + \frac{{{\text{D}}}}{{{\text{E}}}})\\0&=&({\text{g}}) - ({\text{ROA}})({\text{R}})(1 + {\text{g}})(1 + \frac{{{\text{D}}}}{{{\text{E}}}})\end{array}[/latex]
- Note: P times S equals net income. Net income divided by A is the rate of return on assets (ROA).
- Step 3: Substitute ROE for ROA (1 + D/E)
- [latex]\begin{array}{rCl}0&=&({\text{g}}) - ({\text{ROA}})({\text{R}})(1 + {\text{g}})(1 + \frac{{{\text{D}}}}{{{\text{E}}}})\\0&=&({\text{g}}) - ({\text{ROE}})({\text{R}})(1 + {\text{g}})\end{array}[/latex]
- Note: The 3-way analysis of ROE states:
-
- [latex]{\text{ROE}} = \frac{{{\text{Net income}}}}{{{\text{Sales}}}}{\text{x}}\frac{{{\text{Sales}}}}{{{\text{Total assets}}}}{\text{x}}\frac{{{\text{Total assets}}}}{{{\text{Total equity}}}}[/latex]
- If the first two components are simplified, the formula is:
- [latex]{\text{ROE}} = \frac{{{\text{Net income}}}}{{{\text{Total assets}}}}{\text{x}}\frac{{{\text{Total assets}}}}{{{\text{Total equity}}}}[/latex]
- The first component is equal to the ROA:
- [latex]{\text{ROE}} = {\text{ROA x}}\frac{{{\text{Total assets}}}}{{{\text{Total equity}}}}[/latex]
- The second component can be restated as:
- [latex]{\text{ROE}} = {\text{ROA x(}}\frac{{{\text{E}} + {\text{D}}}}{{\text{E}}})[/latex]
- [latex]{\text{ROE}} = {\text{ROA x}}(1 + \frac{{\text{D}}}{{\text{E}}})[/latex]
- Step 4: Expand the formula
- [latex]\begin{array}{rCl}0&=&({\text{g}}) - ({\text{ROE}})({\text{R}})(1 + {\text{g}})\\0&=&({\text{g}}) - ({\text{ROE}})({\text{R}}) - ({\text{ROE}})({\text{R}})({\text{g}})\end{array}[/latex]
- Step 5: Isolate for g
- [latex]\begin{array}{rCl}0&=&({\text{g)}} - ({\text{ROE)(R)}} - ({\text{ROE)(R)(g)}}\\{\text{(ROE)(R)}}&=&({\text{g}}) - ({\text{ROE)}}({\text{R}})({\text{g)}}\\{\text{(ROE)(R)}}&=&({\text{g}})(1 - ({\text{ROE}})({\text{R}}))\\{\text{g}}&=&\frac{{({\text{ROE}})({\text{R}})}}{{(1 - ({\text{ROE}})({\text{R}}))}}\end{array}[/latex]
- Note: g is the SGR.
Increasing the SGR
What if a company has the potential to grow at a faster rate than its SGR due to improving business prospects? The simply solution would be to issue new common equity, but this has problems. Most companies try to grow using retained earnings as their only source of new common equity financing because:
- Issuing new common equity may create control problems for existing shareholders.
- Issuance costs for new common equity are high especially for start-ups and small businesses.
- Start-ups and small businesses may have exhausted all new common equity sources.
- EPS will be diluted in the short-term as it takes time for the new common equity to be put to use effectively in the company.
- Managers are very concerned about issuing common shares when they are undervalued in the stock markets as it will hurt existing shareholders.
If selling new common equity is not an option, then the only way to raise a company’s SGR is to increase its retention ratio or ROE. As discussed, once a company declares a dividend they are unlikely to reduce it in the future as this would signal to the market that they are possibly experiencing financial difficulties which may lead to a decline in share price. Management is more likely to only slow the rate of dividend growth to increase the SGR. Even this action may have a negative impact on share price if investors have come to expect regular dividend increases. Increasing the retention ratio is generally not effective in raising the SGR unless the company has been careful in the past to use stock repurchases to distribute earnings.
[latex]{\text{ROE}} = \frac{{{\text{Net profit margin x Total asset turnover ratio}}}}{{1 - {\text{Debt ratio}}}}[/latex]
All companies should attempt to optimize these ratios on an ongoing basis, but there are strategies that can be used to limit the capital expenditures required to support sales growth and the corresponding financing required. Companies can:
- Increase prices to raise the net profit margin while lowering unit demand and the needed capital expenditures to support the higher output.
- Outsource non-essential business activities especially those requiring large capital expenditures.
- Use “profitability pruning” to sell business units with low net profit margins especially those with large capital requirements.
A company can also increase its ROE by raising it debt ratio. If the ratio is below its optimal level, this is a safe way to increase the SGR. Excessive borrowing though exposes a company to bankruptcy risk and should not be used. Reducing cash reserves to dangerously low levels to fund growth should also be avoided.
After increasing the SGR as much as reasonably possible, if a company’s forecasted growth rate continues to exceed its SGR, the company should lower its growth expectations to avoid serious financial difficulties. Bankers view large differences between a company’s sustainable and actual growth rate as a “red flag” that increased borrowing levels are not sustainable and clients should reduce their growth.
Lowering the SGR
If a company’s SGR exceeds its actual growth rate, it is generating more funds than it needs. The first inclination of management in this situation would likely be to put these funds to work expanding its product line or diversifying into new business areas. When doing this, companies should:
- Make sure all projects have a positive net present value.
- Diversify into related business areas where they have management expertise.
- Avoid acquisitions as they will likely overpay for the target company.
- Not maintain excessive cash or short-term investment balances that earn low returns.
When a company’s SGR exceeds its actual growth rate, it should seriously consider lowering its retention ratio and giving the unneeded funds back to investors who can probably redeploy them in more profitable business ventures. Increasing dividends is not a sign of management failure but an indication that they are working in the best interests of shareholders by reducing agency costs. Companies whose managers do not do this are frequently the target of corporate takeovers. Another firm will buy the company and distribute the surplus cash to shareholders themselves.
A valuable tool in managing corporate growth is to compare a company’s SGR to its actual growth rate over time focusing how the different components of the SGR change.
3.5 | Sustainable Growth at Canadian Companies
Comparing a company’s sustainable and actual growth rates provides valuable insights into its past growth and future prospects. To calculate these rates, analysts should consult the investor relations or corporate information section of a company’s website. Here they provide important financial information for their stakeholders such as the annual report, consolidated financial statements, management discussion and analysis, annual information form, management information circular and other disclosures. These documents can also be found on the System for Electronic Data Analysis and Retrieval (SEDAR) website sponsored by Canada’s securities regulators. In the U.S., similar reports are available on the company’s website or through the Electronic Data Gathering Analysis Retrieval (EDGAR) system hosted by the U.S. Securities Exchange Commission. CAE gives a practical example of SGR analysis.
CAE
CAE is a Canada-based global leader in training solutions for the civilian aviation, defence and security, and healthcare markets. Utilizing both virtual and live methods, CAE trains over 220,000 civil and military crewmembers and thousand of medical professionals at approximately 160 training sites in over 35 countries. With a world-wide shortage of pilots, rising defence budgets, and growing healthcare spending, CAE expects continued strong growth in the future. In 2019, the company had nearly CAD 3.304 billion in revenues and profits of CAD 340.1 million.
Exhibit 5: Sustainable Growth Rate
| 2015 | 2016 | 2017 | 2018 | 2019 | 5-Year Average | |
|---|---|---|---|---|---|---|
| Dividends (CAD millions) | 46.3 | 56.7 | 80.6 | 89.9 | 99.9 | 74.7 |
| Stock repurchases (CAD millions) | 0.0 | 7.7 | 41.7 | 44.8 | 94.4 | 37.7 |
| Share issuances (CAD millions) | 12.7 | 15.9 | 12.7 | 15.7 | 18.3 | 15.1 |
| Cash and cash equivalents (CAD millions) | 330 | 485 | 505 | 612 | 446 | 476 |
| Retention ratio | 0.84 | 0.79 | 0.57 | 0.66 | 0.48 | 0.67 |
| Net profit margin (%) | 9.1% | 9.2% | 9.5% | 12.6% | 10.3% | 10.1% |
| Asset turnover ratio | 0.48 | 0.50 | 0.50 | 0.49 | 0.46 | 0.49 |
| Debt ratio (%) | 64.3% | 65.5% | 62.7% | 60.3% | 66.4% | 63.8% |
| ROE (%) | 12.3% | 13.4% | 12.8% | 15.4% | 14.1% | 13.6% |
| Sustainable growth rate (%) | 11.5% | 11.8% | 7.9% | 11.4% | 7.3% | 10.0% |
| Actual growth rate (%) | 8.1% | 11.9% | 7.6% | 4.4% | 17.0% | 9.8% |
CAE has been able to fund its high growth internally over the last five years without slowing its growth or issuing excessive amounts of new debt or common shares. In fact, the company has reduced its retention ratio substantially to move surplus funds out of the business to shareholders instead of investing them in low-yielding marketable securities. Dividends increases were modest, but the company used stock repurchases to give it the flexibility to take advantage of future growth opportunities without having to cut its dividends. Net profit margin and asset turnover ratio have been relatively stable although they did decline in the last year.
3.5 | Exercises
-
Problem: Short-term Financial Planning
Sales
Wind’n Wave Enterprises is a wholesaler of wind surfers, which currently sells one model, the Wave Rider (WR). The product is sold locally through major sports stores. The company has also begun to export, which helps to smooth out seasonal fluctuations in production and sales. At present, the business has three local customers and one overseas.
Wind’n Wave 2018 Sales Forecast (Units) Q1 Q2 Q3 Q4 Year Local Customer 1 43 76 58 27 204 Customer 2 56 122 87 22 287 Customer 3 33 66 48 17 164 Sub-total 132 264 193 66 655 Export 77 114 115 77 383 Total 209 378 308 143 1,038 Expected prices for 2018 for Wave Rider are:
Price (CAD Per Unit) Local Export Wave Rider (WR) 900 675 Twenty percent of sales are for cash. Of the credit sales, approximately 70.0% are paid for in the quarter the sale takes place and the balance are collected in the following quarter with negligible bad debts.
Sales in the first quarter of 2019 are expected to be 250 units, which is 20.0% higher than the first quarter of 2018.
Cost of Goods Sold
Wind’n Wave gets its product from a system of small independent contractors. In the coming year, the company expects to be able to buy Wave Riders for CAD 525.
Seventy percent of all merchandise purchased is paid for in that quarter. The remainder is paid for in the following quarter.
Company policy is to maintain merchandise inventory in units equal to 30.0% of the next quarter’s estimated sales in units. This is to guard against supply interruptions, which are frequent given the size of its suppliers. Beginning inventory on January 1, 2018 consists of 63 units.
Operating Expenses
Wind’n Waves financial manager has put together the following information on estimated operating expenses for 2018:
Category Details Selling Fixed component of CAD 35,500 a year plus a variable component equal to 1.0% of sales revenue for sales commissions. Distribution All variable equal to CAD 7 per unit for local sales and CAD 15 per unit for exports. Administrative All fixed equal to CAD 45,200 a year including CAD 7,000 for depreciation of fixed assets and CAD 18,000 in rent. All fixed costs are incurred uniformly throughout the year and are paid for as incurred.
Capital Budget
Wind’n Wave’s financial manager has reviewed an updated list of capital expenditures in 2018 and has selected the following projects:
Item Estimated Cost When New computer with associated software for bookkeeping, scheduling, and word processing – 5-year life CAD 26,000 End Q1 New office equipment – 10-year life CAD 19,500 End Q2 Depreciation charges for these assets were not included in the administration budget.
Financing
Wind’n Wave has an 8.0% line of credit, which allows it to borrow up to CAD 40,000 to finance its accounts receivable and inventories. The bank allows Wind’n Wave to borrow up to 50.0% of the value of their good accounts receivable but nothing against their finished goods inventory due to its highly specialize nature. Interest is paid quarterly and any borrowing or paying down of the loan is be done at the end of each quarter. The line of credit must be paid down to zero once per year.
The company’s purchases of capital assets can be financed with a term loan. Interest is paid quarterly at a rate of 10.0%. The principal is paid down on a straight-line basis over the life of the asset. Payments are made quarterly. Up to 80.0% of the asset’s value can be borrowed.
Company policy is to try to maintain a cash balance of CAD 20,000 at all times to guard against unexpected cash outflows. This approximates 10.0% of quarterly cash disbursements. Surplus cash can be invested in 3-month term deposits earning 5.0%. Interest is paid quarterly.
Quarterly and annual financial statements must be submitted to the bank. In addition to the required coverage ratio, the bank requires that a current ratio of at least 1.5X be maintained on a quarterly basis. Also, an annual cash flow coverage ratio of at least 2.0 must be maintained.
The goal for the long-term debt to total capitalization ratio is 40.0%. Company policy is to match the maturity of its assets and financing if possible.
Dividends
Regular dividends of CAD 15,000 are to be paid out each quarter unless a serious cash shortage prevents it. Special dividends can be paid if the company’s cash balance becomes excessive.
Income Taxes
The corporate tax rate is 45.0%. Taxes are paid at the end of each quarter.
Balance Sheet
Wind’n Wave Balance Sheet
December 31, 2017
Current assets Cash CAD 21,483 Accounts receivable 26,700 Inventory 32,918 Total current assets CAD 81,101 Fixed assets Equipment 91,788 Total assets CAD 172,889 Current liabilities Line of credit – Accounts payable CAD 27,563 Current portion of long-term debt 10,000 Total current liabilities CAD 37,563 Long-term liabilities Term loan 50,000 Shareholders’ equity Share capital 53,000 Retained earnings 32,326 Total liabilities and equity CAD 172,889 REQUIRED:
- Prepare budgeted income statements, cash flow statements, balance sheets, and key financial ratios for Q1 2018.
- Why did the company experience a cash shortage in Q1?
- What actions could be taken to increase cash flows in Q1?
- What actions could be taken to increase the current ratio in Q1?
- What actions could be taken to reduce the long-term debt to total capitalization ratio in Q1?
- How was the CAD 35,000 limit on the line of credit determined?
- How was the desired cash level of CAD 20,000 determined?
- Prepare pro forma financial statements and key financial ratios for Q2, Q3, and Q4 2018.
- Analyze the financial decisions made in Q1, Q2, Q3, and Q4 2018 focusing on the interrelationships between each of the quarters.
-
Problem: Percentage of Sales Method
The following are the financial statements of Quick Silver Ltd. for the previous year.
2013 Net sales CAD 4,377,432 Expenses Cost of sales CAD 3,185,784 Marketing and sales 496,786 Administration and research 285,475 Interest 34,563 Depreciation 126,777 Earnings before taxes CAD 248,047 Income taxes 74,414 Net income CAD 173,633 2013 Current assets Cash CAD 34,756 Temporary investments 305,815 Accounts receivables 550,345 Inventories 394,356 Prepaid expenses 30,345 Total current assets CAD 1,315,617 Property, plant, equipment 1,320,334 Other assets 257,654 Total assets CAD 2,893,605 Current liabilities Accounts payable 532,902 Accrued payroll payables 243,826 Income taxes payable 6,201 Total current liabilities CAD 782,929 Long-term liabilities 597,853 Shareholders’ equity 1,512,824 Total liabilities and equity CAD 2,893,605 Quick Silver estimates that sales will increase by 5.0% over each of the next three years. The company has a target long-term debt to total capitalization ratio of 30.0% which is 10.0% below the industry average. Quicksilver founder and CEO had difficulties with excessive debt early on in the company’s life and has compensated by borrowing less. Dividends are currently CAD 80,000 per year and company policy is to increase dividends only if they can be maintained. The company also refuses to lower dividends as it will cause excessive market pessimism leading to a lower share price. The issuance of new equity is avoided for reasons of control.
REQUIRED:
- Prepare proforma income statements, cash flow statements, and balance sheets for the next three years. Can the company meet its goal of 5.0% growth over the next three years without reducing the regular dividend or issuing new common shares?
- Could a 20.0% growth rate over the next three years be supported? Discuss.
-
Problem: Adjusting Asset Requirements for Excess Capacity
Meta Industries’ sales were CAD 150 million in the current year but are expected to increase by 10.0% next year. The company’s fixed assets are currently underutilized and could support sales of approximately CAD 170 million. Capacity can be added in increments of CAD 20 million in sales at a cost of CAD 8 million.REQUIRED:
- What is Meta’s capacity utilization?
- How much additional fixed assets will be required next year?
- How would the answer to Part 2 change if sales were expected to increase by 20.0% next year?
-
Problem: Analyzing Sustainable Growth at Wicker Company
The following are selected financial data for Wicker Company, a patio furniture manufacturer:
2011 2012 2013 2014 2015 Retention ratio 1.00 0.90 0.85 0.74 0.65 Net profit margin (%) 7.90 8.10 8.10 8.20 8.40 Asset turnover 1.34 1.22 1.17 1.14 1.07 Assets/equity 2.49 2.15 1.81 1.61 1.31 Actual growth rate (%) 5.67 8.95 10.10 9.45 8.73 REQUIRED:
- Calculate the sustainable growth rate for 2011 through 2015.
- Analyze the differences between the actual and sustainable growth rates.
Discussion
-
Problem: Analyzing Sustainable Growth at Telsa Fashions
The following are selected financial data for Telsa Fashions, a women’s clothing retail chain with extensive e-commerce operations:
2011 2012 2013 2014 2015 Retention ratio 1.00 1.00 1.00 1.00 1.00 Profit margin (%) 0.45 0.52 2.85 3.72 3.81 Asset turnover 2.24 2.41 2.48 2.51 2.53 Assets/equity 1.85 1.85 2.01 2.19 2.39 Actual growth rate (%) 8.9 10.3 18.9 28.9 29.85 REQUIRED:
- Calculate the sustainable growth rate for 2011 through 2015.
- Analyze the differences between the actual and sustainable growth rates.
-
Problem: Analyzing Sustainable Growth at Caribou Manufacturing
Wilma Cartlidge is the sole owner of Caribou Manufacturing in Kamloops, British Columbia. The company began operations in early 2011 and has experienced rapid growth.
2011 2012 2013 2014 2015 Retention ratio 1.00 0.85 0.75 0.65 0.60 Net profit margin (%) 3.50 4.50 5.20 5.50 5.00 Asset turnover ratio 1.35 1.43 1.51 1.59 1.61 Debt ratio (%) 25.21 31.25 34.78 44.45 55.01 ROE (%) 6.32 9.36 12.04 15.74 17.89 Sustainable growth rate (%) 6.74 8.64 9.93 11.40 12.03 Actual growth rate (%) 6.32 8.45 9.79 11.43 12.25 Cartlidge is very proud of her success and her ability to manage the company’s growth without having to raise new equity or refuse new business. Many of her colleagues told her that periods of rapid growth were some of the most challenging for small businesses.
Cartlidge is preparing to meet with her banker to discuss a new loan application for 2016. Last year, the banker showed considerable hesitation about approving any new loans but she still managed to convince him to approve her application.
REQUIRED:
- Analyze Caribou’s growth over the last five years and make recommendations for change.
-
Problem: Analyzing Sustainable Growth at Beluga Manufacturing
Jurgen Vincenten owns Beluga Manufacturing Ltd. in Churchill, Manitoba, which has been in existence for five years.
2015 2016 2017 2018 2019 Industry Average Retention ratio 1.00 0.83 0.74 0.62 0.48 0.65 Net profit margin (%) 3.62 4.29 4.56 4.41 4.38 6.31 Asset turnover ratio 1.39 1.51 1.53 1.48 1.47 1.69 Debt ratio (%) 20.33 33.78 39.67 47.38 59.23 35.22 ROE (%) 6.32 9.78 11.56 12.40 15.79 16.46 Sustainable growth rate (%) 6.74 8.84 9.36 8.33 8.20 11.98 Actual growth rate (%) 6.70 8.73 9.32 8.43 8.32 12.01 Beluga grew over this period but had to slow its growth in recent years by refusing sales from new customers because of insufficient financing from its bank. Vincenten felt his growth rate could have exceeded the industry average if financing was available. Raising new equity capital by bringing in new owners is not an option for Vincenten as he feels he does not have the temperament to share control with anyone.
Beluga’s banker requested a meeting in early January 2020 to discuss Beluga’s loans and the overall condition of the business. Last year the banker was very concerned about Beluga’s financial position, but Vincenten felt he would be satisfied this year given Beluga’s continue growth.
Vincenten has just completed the construction of a new home overlooking the Hudson’s Bay in Churchill.
REQUIRED:
- Analyze Beluga’s growth over the last five years and make recommendations for change.
